Fig. 3.
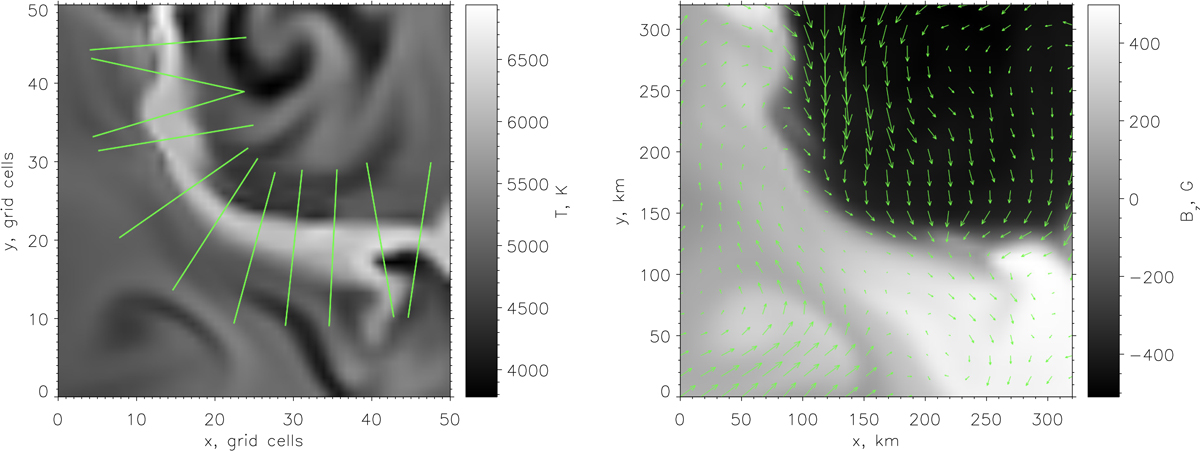
Algorithm for determining the magnetic field and flow structure around reconnection current sheets, and magnetic field and flow structure around a simulated photospheric reconnection region. Left panel: an example of the averaging algorithm used for diagnostics of the simulated data. The background image is the horizontal cut of the temperature at the height of 300 km above the average continuum formation height. It shows the temperature enhancements in the current sheet region due to the current dissipation. The axes units are grid cells with 6.25 km per grid cell. The green lines are constructed to align with the direction of the strongest change of vertical component of magnetic field at each point of the current sheet. The velocities are projected onto the direction parallel to the strongest gradient direction. Right panel: the vertical component of magnetic field. Arrows indicate the horizontal plasma flow direction. A flow, converging towards the reconnection region is clearly visible.
Current usage metrics show cumulative count of Article Views (full-text article views including HTML views, PDF and ePub downloads, according to the available data) and Abstracts Views on Vision4Press platform.
Data correspond to usage on the plateform after 2015. The current usage metrics is available 48-96 hours after online publication and is updated daily on week days.
Initial download of the metrics may take a while.