Free Access
Fig. B.1.
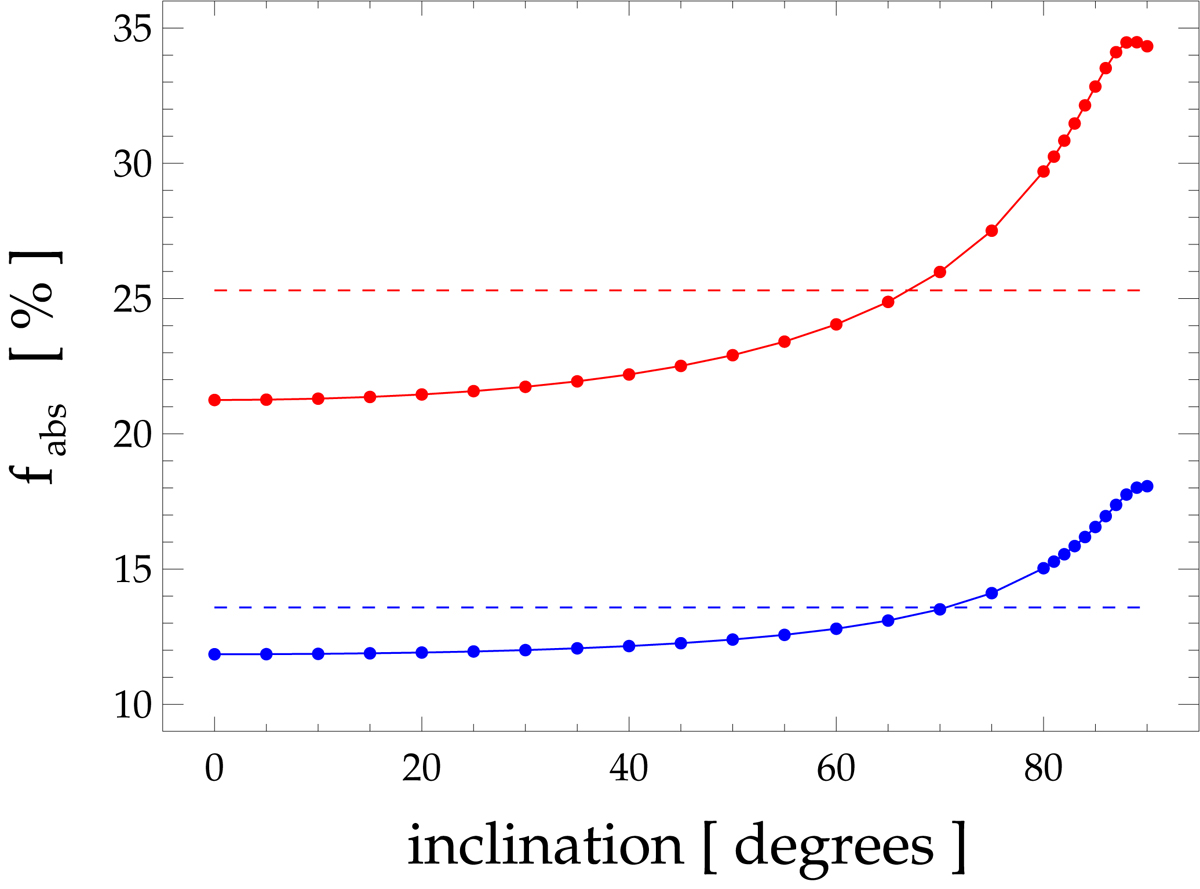
fabs vs. inclination estimated from the SEDs of the average edge-on galaxy model of De Geyter et al. (2014, blue lines and symbols), and from the model with 3× the dust mass (red lines and symbols). In both cases, dashed lines refers to the true fabs derived from the RT energy budget.
Current usage metrics show cumulative count of Article Views (full-text article views including HTML views, PDF and ePub downloads, according to the available data) and Abstracts Views on Vision4Press platform.
Data correspond to usage on the plateform after 2015. The current usage metrics is available 48-96 hours after online publication and is updated daily on week days.
Initial download of the metrics may take a while.