Fig. 10.
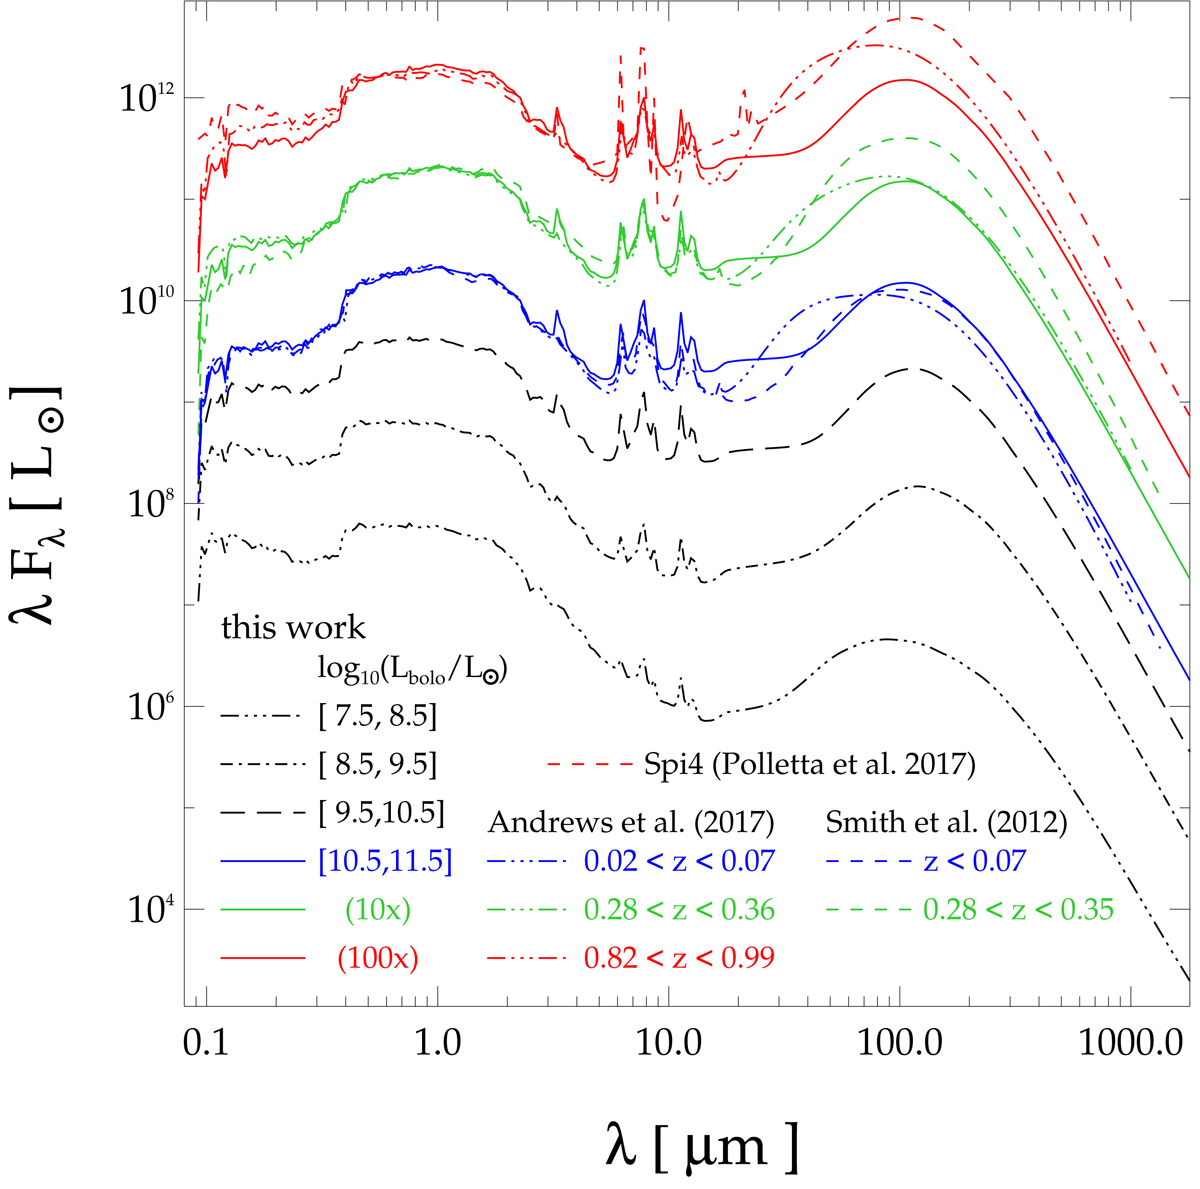
Average templates of Fig. 9, scaled to the mean Lbolo of each sub-sample. The highest-Lbolo template is shown three times, at the original scale (solid blue line) and multiplied by arbitrary factors (solid green and red lines). Also shown are two templates at different redshifts from Smith et al. (2012a), three CSEDs from Andrews et al. (2017), and the Spi4 template of Polletta et al. (2007). The SEDs from the literature have been normalised to the stellar luminosity of the highest-Lbolo template.
Current usage metrics show cumulative count of Article Views (full-text article views including HTML views, PDF and ePub downloads, according to the available data) and Abstracts Views on Vision4Press platform.
Data correspond to usage on the plateform after 2015. The current usage metrics is available 48-96 hours after online publication and is updated daily on week days.
Initial download of the metrics may take a while.