Fig. A.1
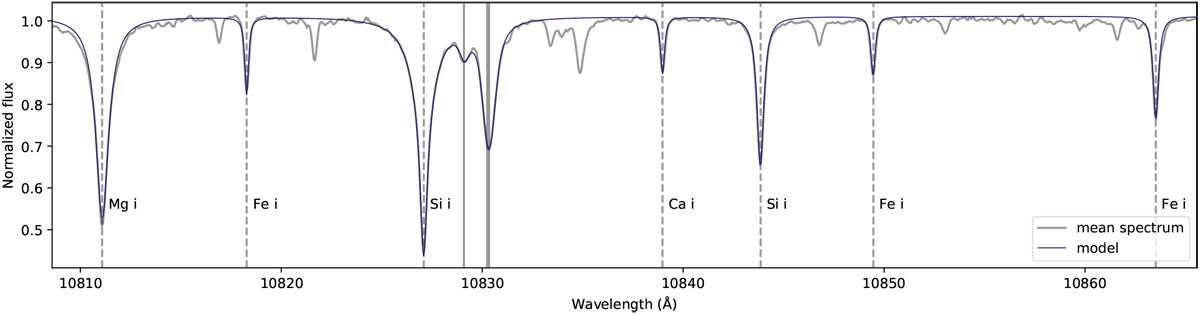
Spectral region of the He I λ10830 Å lines. The gray line is the average stellar spectrum, the dark-blue line is a model that includes the seven strongest stellar lines in the direct vicinity of the triplet lines used for the correction of the stellar rest frame. The position of the He I triplet is marked by vertical solid lines; the other seven spectral lines are labeled and marked by dashed lines.
Current usage metrics show cumulative count of Article Views (full-text article views including HTML views, PDF and ePub downloads, according to the available data) and Abstracts Views on Vision4Press platform.
Data correspond to usage on the plateform after 2015. The current usage metrics is available 48-96 hours after online publication and is updated daily on week days.
Initial download of the metrics may take a while.