Free Access
Fig. 5
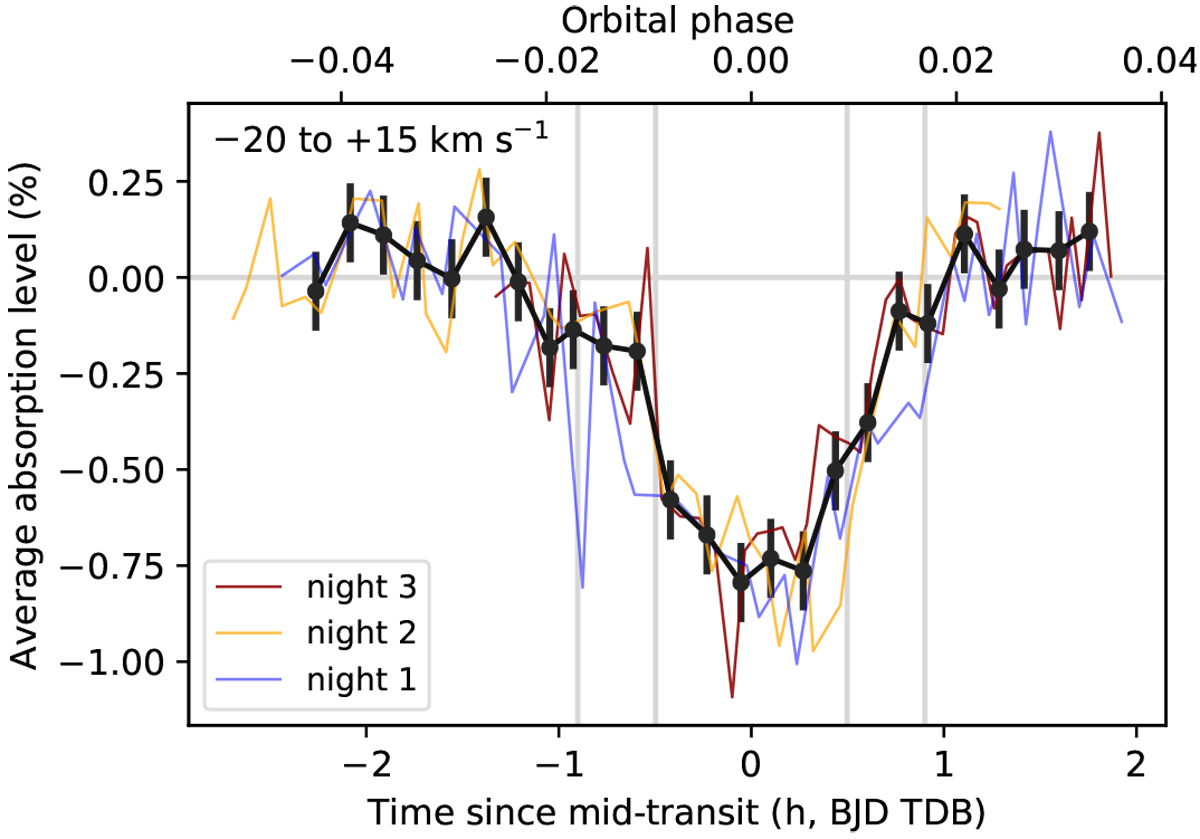
Time evolution of the He I λ10830 Å signal during the three nights. Vertical lines mark the contact points of the broad band optical transit (T1 –T4). The mean transit light curve (black line) is shown with error bars.
Current usage metrics show cumulative count of Article Views (full-text article views including HTML views, PDF and ePub downloads, according to the available data) and Abstracts Views on Vision4Press platform.
Data correspond to usage on the plateform after 2015. The current usage metrics is available 48-96 hours after online publication and is updated daily on week days.
Initial download of the metrics may take a while.