Fig. 2
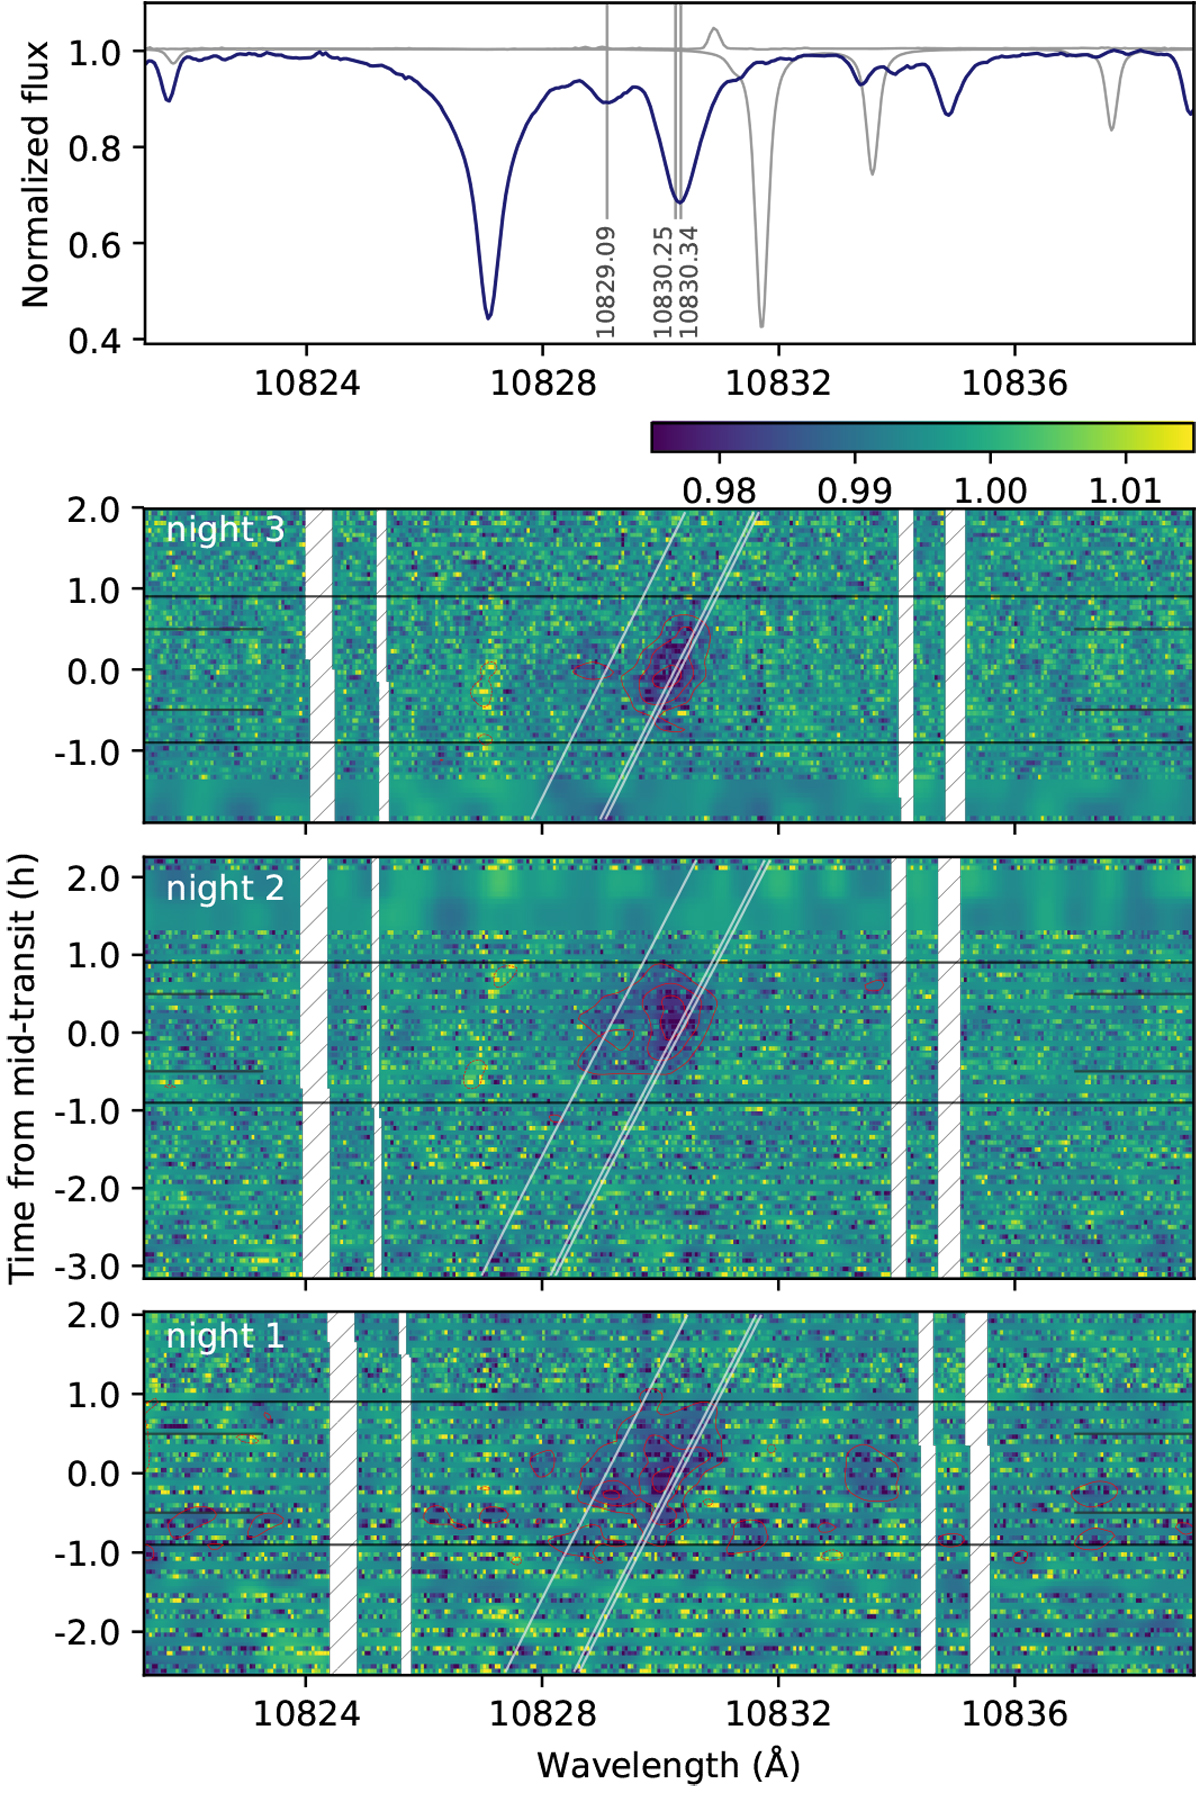
Top panel: out-of-transit spectrum around the He I λ10830 Å lines after removal of telluric lines and averaged over the three observing nights. The triplet line positions are marked by vertical lines labeled by their central wavelength. A telluric absorption spectrum and the average telluric emission spectrum from night 3 are depicted by gray lines. Lower panels: time series of residual spectra for three transits of HD 189733 bin the stellar rest frame. Rows depict individual residual spectra with color-coded intensity; time progresses along the y-axis, and row height and gaps correspond to the exposure times. We use a linear interpolation over the gaps and apply a Gaussian smoothing and transparency for distinction. Masked regions are likely affected by bad pixels. First and fourth contacts of the optical transit are marked by horizontal lines, and second and third contacts are indicated by shorter vertical lines at the figure edges. The slanted lines show the position of the He I triplet lines in the planetary rest frame. Red solid and dashed contours are respectively 0.33% negative and positive variations from mean.
Current usage metrics show cumulative count of Article Views (full-text article views including HTML views, PDF and ePub downloads, according to the available data) and Abstracts Views on Vision4Press platform.
Data correspond to usage on the plateform after 2015. The current usage metrics is available 48-96 hours after online publication and is updated daily on week days.
Initial download of the metrics may take a while.