Free Access
Fig. B.1
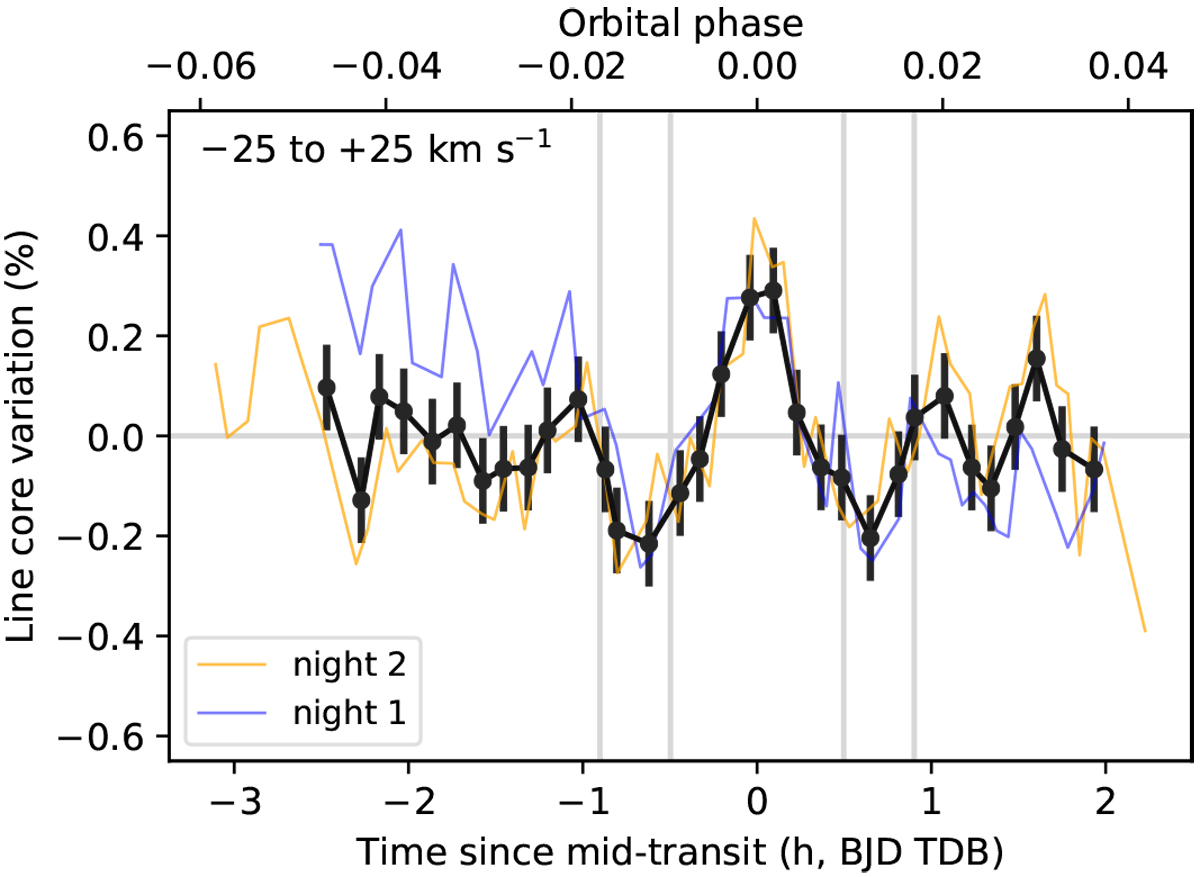
Light curves of the averaged three Ca IRT lines during the first two transit nights. The bold curve shows the mean light curve after correction of activity trends. Vertical lines mark the contact points of the optical transit.
Current usage metrics show cumulative count of Article Views (full-text article views including HTML views, PDF and ePub downloads, according to the available data) and Abstracts Views on Vision4Press platform.
Data correspond to usage on the plateform after 2015. The current usage metrics is available 48-96 hours after online publication and is updated daily on week days.
Initial download of the metrics may take a while.