Fig. A.3
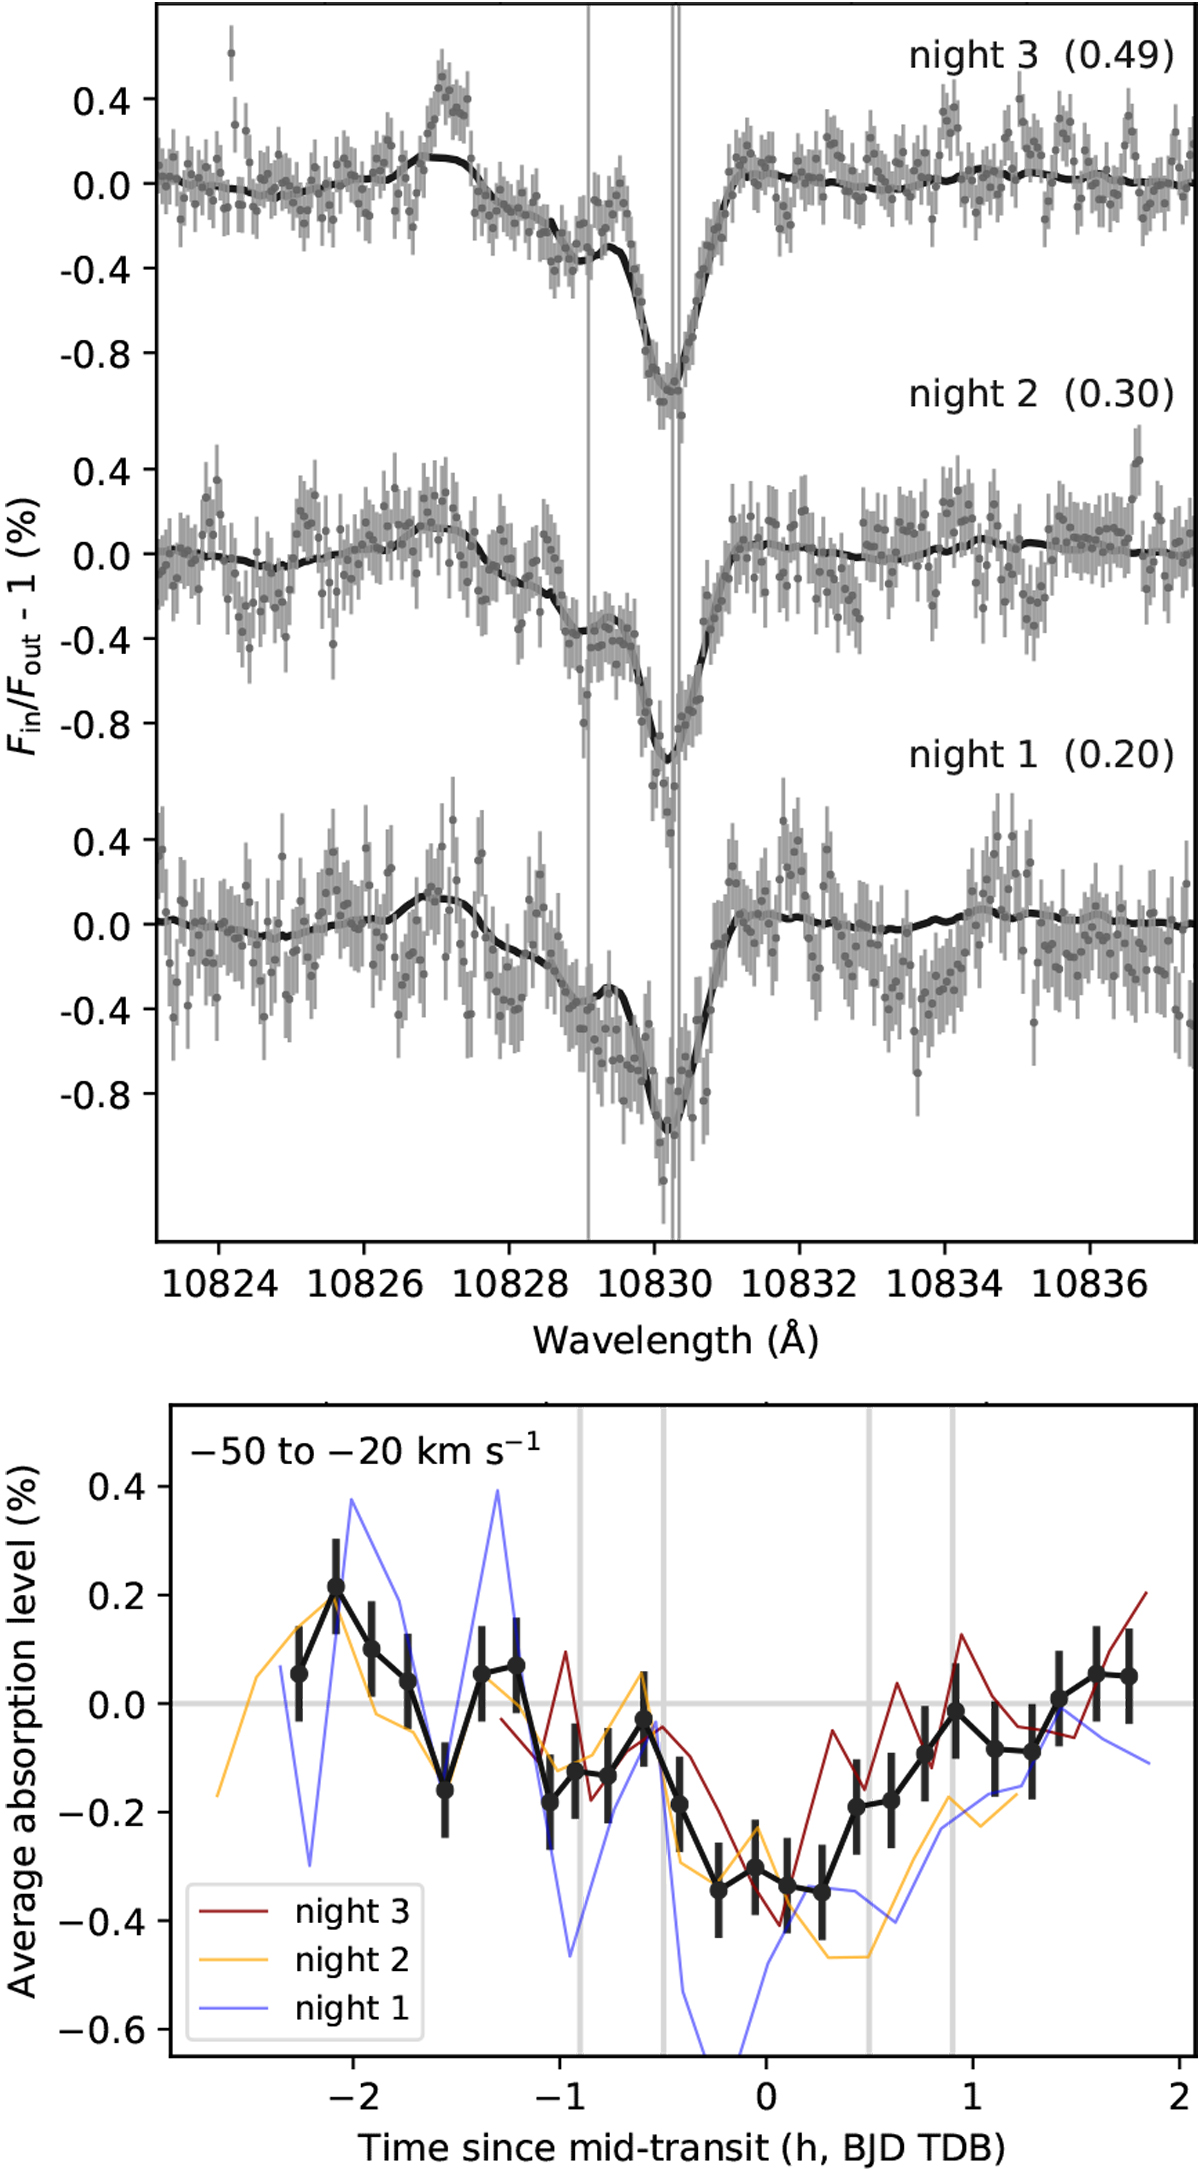
Top panel: transmission spectra of the three individual transits in the planetary rest frame. The He I triplet is indicated by vertical lines. In parentheses we provide the weights for computing the weighted mean absorption profile. For comparison, a smoothed version of the mean absorption profile is given by the black solid line. For a discussion, see Sects. 3.3 and 3.4. Bottom panel: same as Fig. 5, but for the He I λ 10829 Å line.
Current usage metrics show cumulative count of Article Views (full-text article views including HTML views, PDF and ePub downloads, according to the available data) and Abstracts Views on Vision4Press platform.
Data correspond to usage on the plateform after 2015. The current usage metrics is available 48-96 hours after online publication and is updated daily on week days.
Initial download of the metrics may take a while.