Free Access
Fig. A.1
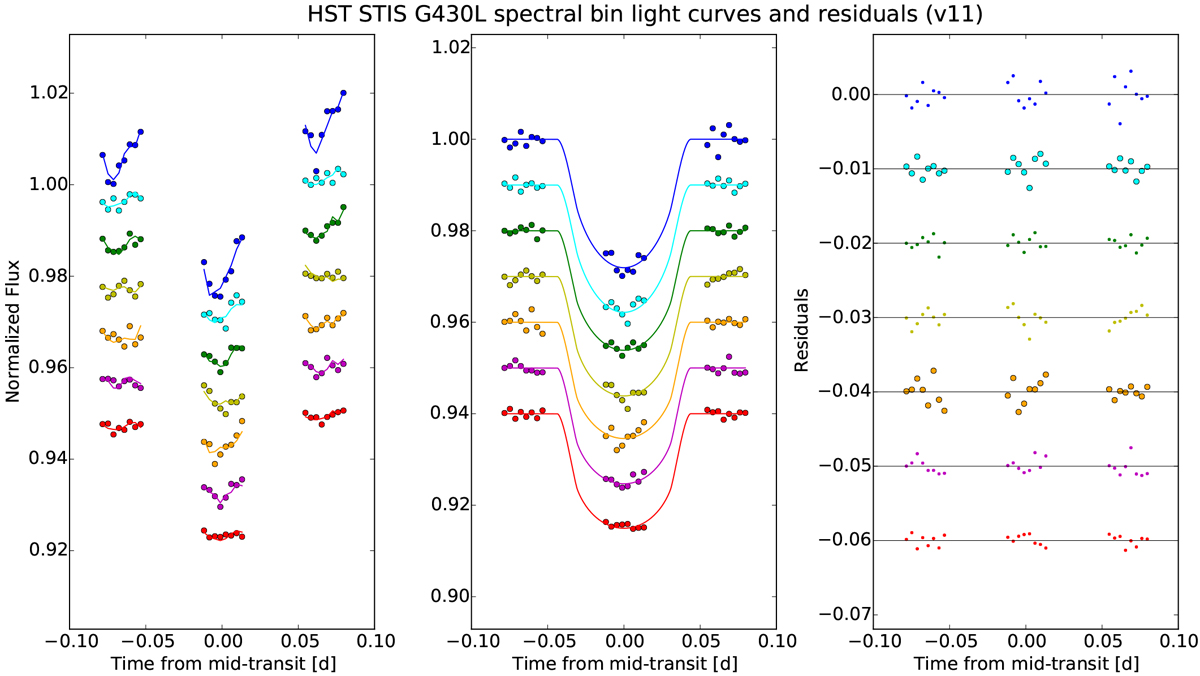
Raw light curves of HST visit 11 (left panel) and detrended light curves (middle panel). Overplotted are the fitted models of the homogeneous analysis of Sect. 5.3. The associated residuals are presented in the right panel. The curves are shifted arbitrarily for clarity.
Current usage metrics show cumulative count of Article Views (full-text article views including HTML views, PDF and ePub downloads, according to the available data) and Abstracts Views on Vision4Press platform.
Data correspond to usage on the plateform after 2015. The current usage metrics is available 48-96 hours after online publication and is updated daily on week days.
Initial download of the metrics may take a while.