Fig. 8
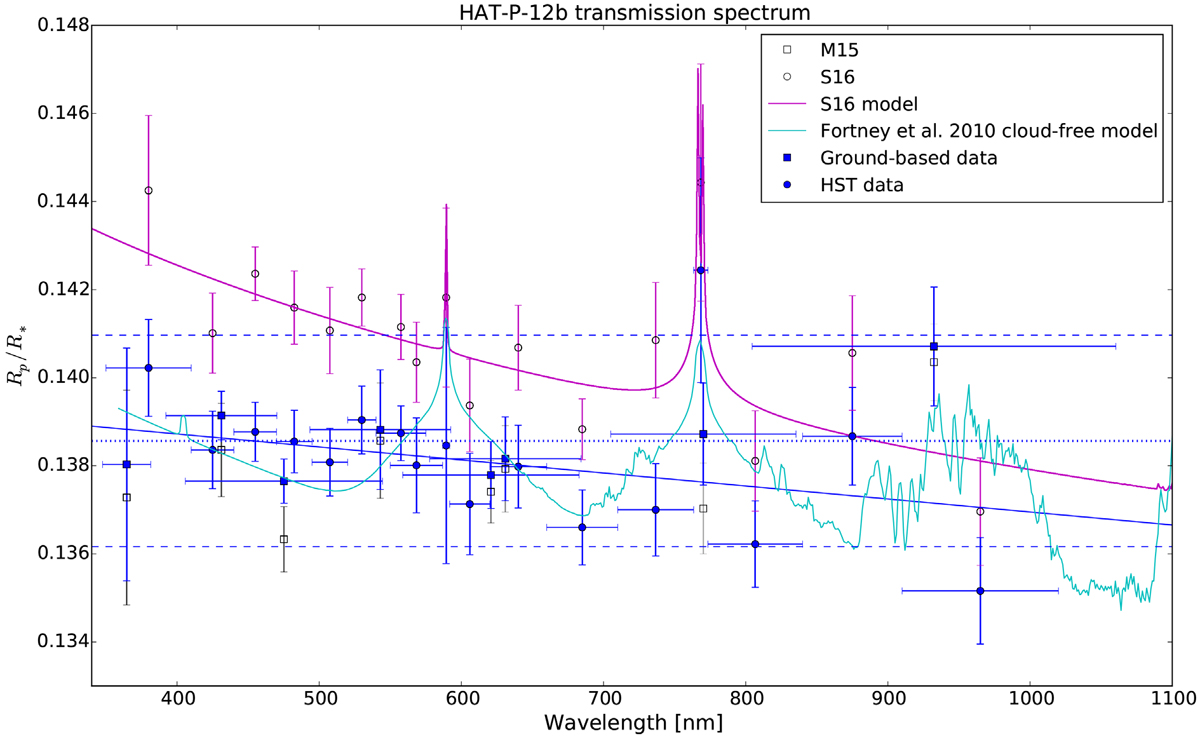
Transmission spectrum of HAT-P-12b as derived from the homogeneous reanalysis of all data from the ground and from the HST with their associated error bars. For reference and comparison, we overplot the values obtained by M15 (black empty squares). The blue dashed lines show plus–minus two scale heights from the weighted average value of k (blue dotted line). In magenta we show the values of S16 together with the suggested atmospheric model (magenta solid line). The cyan solid overplotted line represents the cloud-free, solar-composition model of HAT-P-12bfrom Fortney et al. (2010) for comparison. The blue solid line is a linear regression of the weighted k values.
Current usage metrics show cumulative count of Article Views (full-text article views including HTML views, PDF and ePub downloads, according to the available data) and Abstracts Views on Vision4Press platform.
Data correspond to usage on the plateform after 2015. The current usage metrics is available 48-96 hours after online publication and is updated daily on week days.
Initial download of the metrics may take a while.