Free Access
Fig. 6
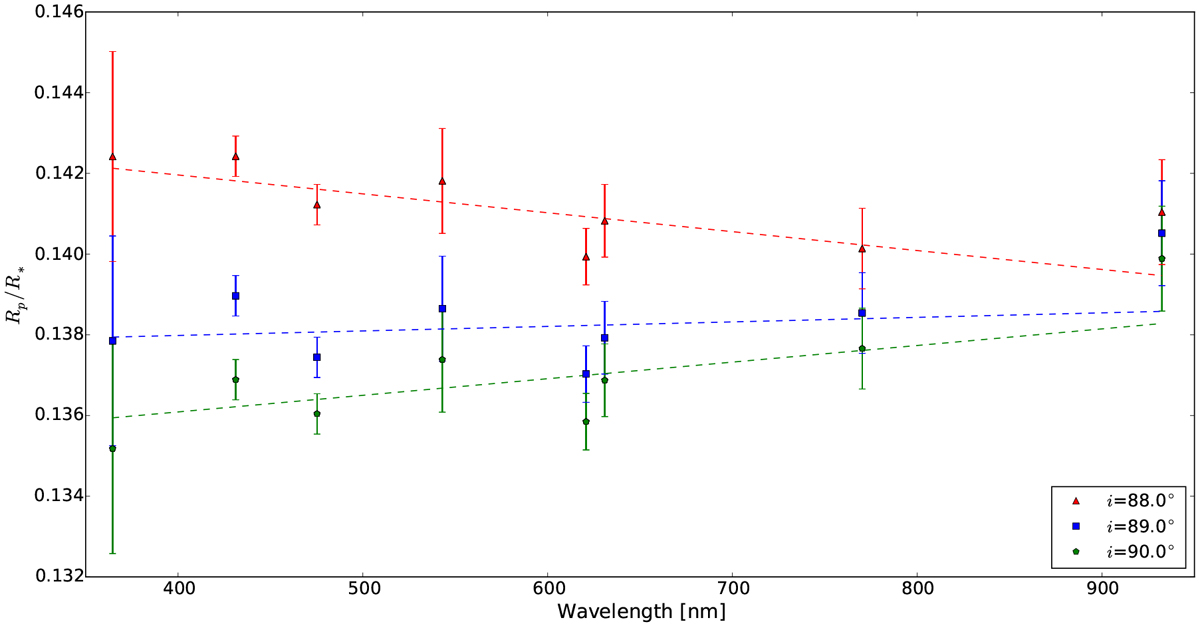
Variation in transmission spectrum for three different inclination values. Different values of i cause an offset in k, which is wavelength dependent. This effect can mimic a slope in the transmission spectrum. The dashed lines mark linear regressions.
Current usage metrics show cumulative count of Article Views (full-text article views including HTML views, PDF and ePub downloads, according to the available data) and Abstracts Views on Vision4Press platform.
Data correspond to usage on the plateform after 2015. The current usage metrics is available 48-96 hours after online publication and is updated daily on week days.
Initial download of the metrics may take a while.