Free Access
Fig. 2
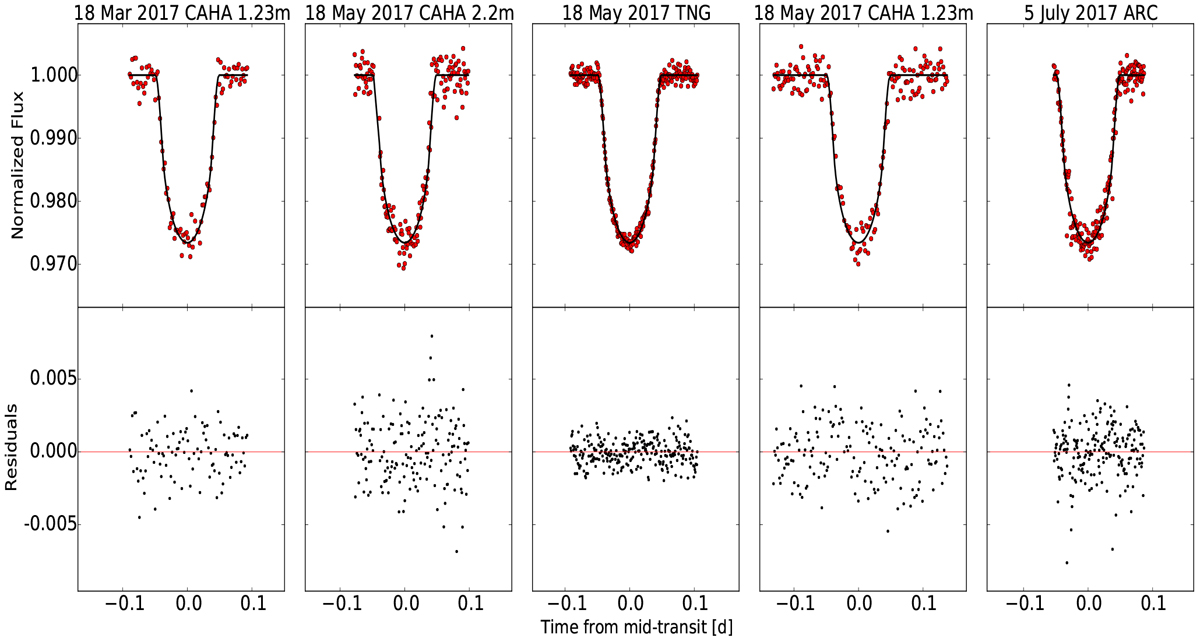
Newly obtained B band light curves of the transit event of HAT-P-12b (upper panels). The light curves are fit and detrended according to the description of the homogeneous reanalysis in Sect. 5.3. Associated residuals of each light curve (lower panels).
Current usage metrics show cumulative count of Article Views (full-text article views including HTML views, PDF and ePub downloads, according to the available data) and Abstracts Views on Vision4Press platform.
Data correspond to usage on the plateform after 2015. The current usage metrics is available 48-96 hours after online publication and is updated daily on week days.
Initial download of the metrics may take a while.