Press Release
Free Access
Fig. 9.
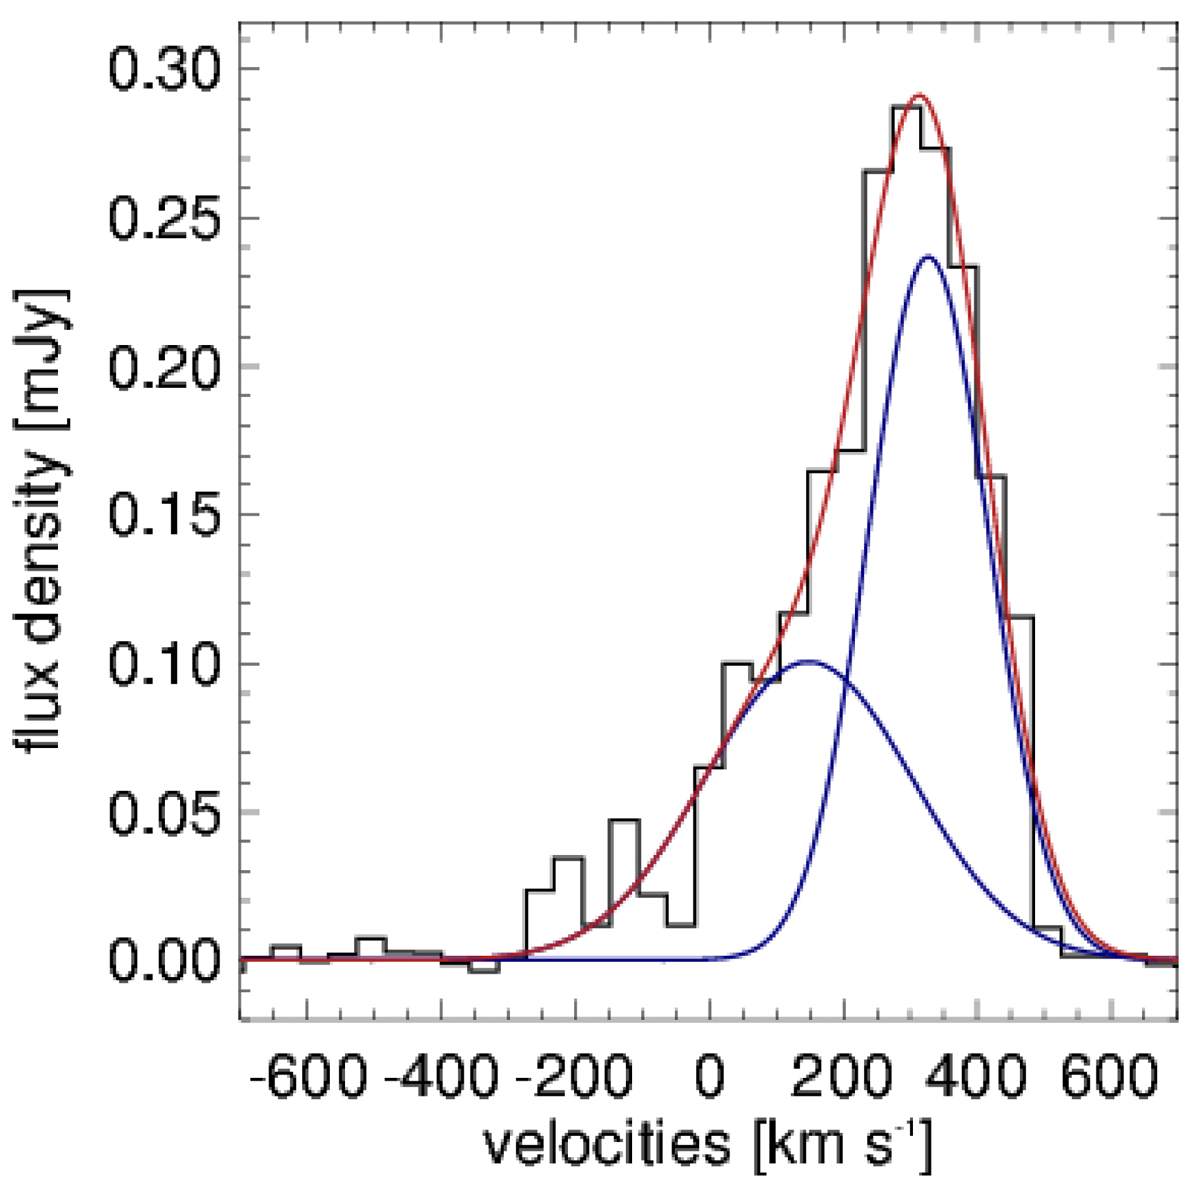
Spatially-integrated CO(4–3) spectrum of the region shown in Fig. 8 where we detect a secondary emission-line component. The red line shows the double-Gaussian fit to the overall spectrum and blue lines show the individual blueshifted and systemic components.
Current usage metrics show cumulative count of Article Views (full-text article views including HTML views, PDF and ePub downloads, according to the available data) and Abstracts Views on Vision4Press platform.
Data correspond to usage on the plateform after 2015. The current usage metrics is available 48-96 hours after online publication and is updated daily on week days.
Initial download of the metrics may take a while.