Fig. 7.
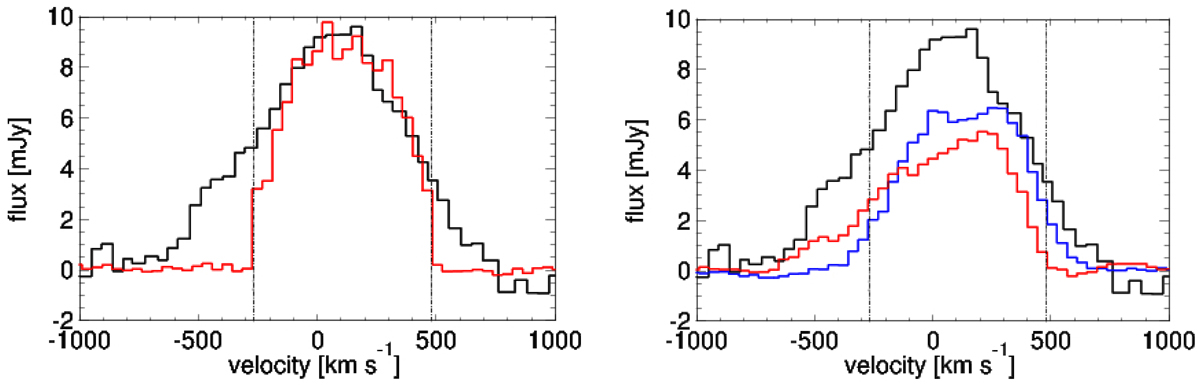
PdBI CO(4–3) line profiles of the Emerald (the main arc of PLCK_G165.7+49.0, red line in the left panel) and the two nearby sources, Co–N and Co–S (red and blue lines in the right panel), compared to the GBT CO(1–0) line profile of Harrington et al. (2018, black line in both panels). The wings in the spatially-integrated CO(1–0) line profile are not detected toward the arc, but their velocity range is well-matched with the range covered by the CO(4–3) line emission from sources Co–N and Co–S, which are blended with the arc in the GBT beam.
Current usage metrics show cumulative count of Article Views (full-text article views including HTML views, PDF and ePub downloads, according to the available data) and Abstracts Views on Vision4Press platform.
Data correspond to usage on the plateform after 2015. The current usage metrics is available 48-96 hours after online publication and is updated daily on week days.
Initial download of the metrics may take a while.