Fig. 6.
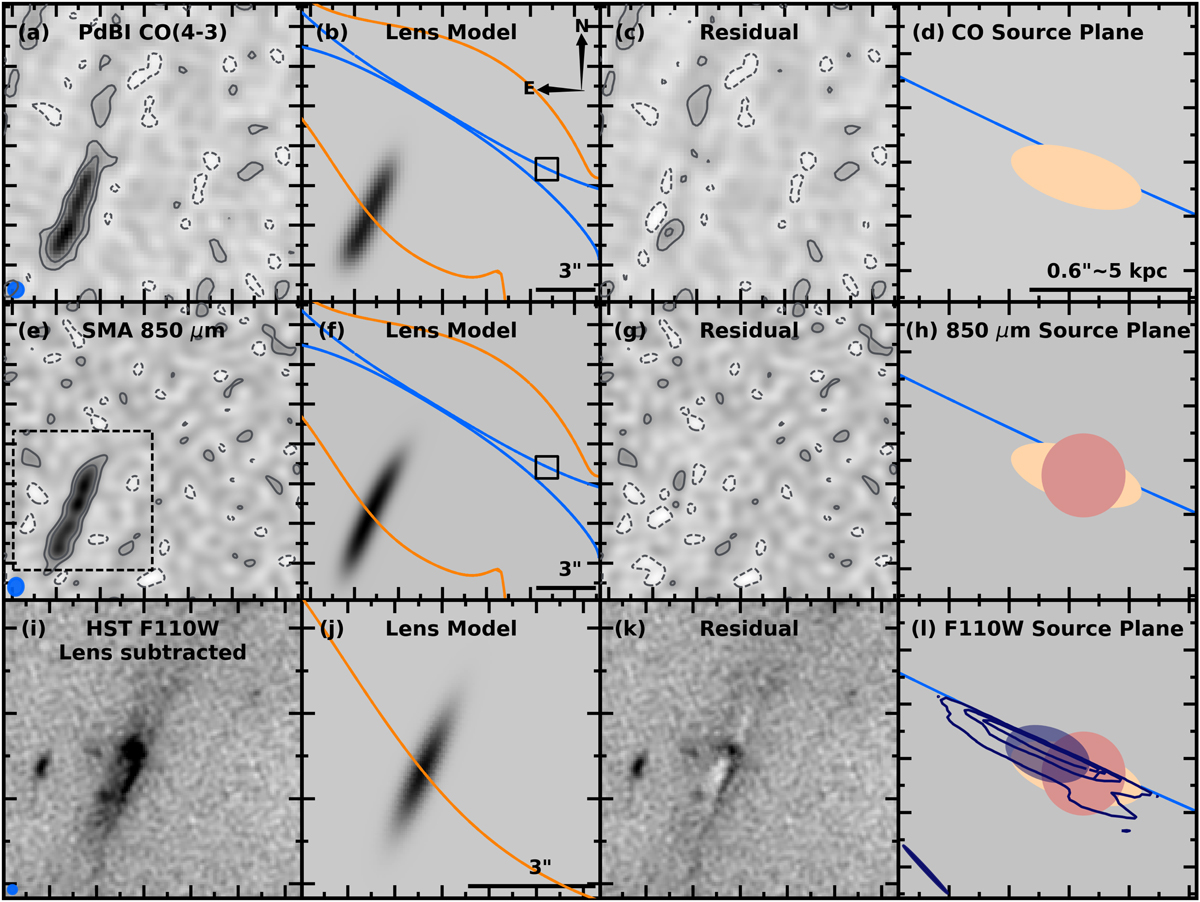
Source-plane reconstruction of the gas, dust and stellar emission from the Emerald, using the best-fitting lens model of the massive foreground cluster. Top row: (a) PdBI map summed over the frequency channels of the CO(4–3) line. The black lines show contours at −2σ (dashed lines), +2 and +5σ (solid lines). The beam of the PdBI at the redshifted frequency of CO(4–3) is plotted in the lower-left corner. (b) Best-fit source model ray-traced to the image plane and convolved with the PdBI beam (see details in the text). Orange and blue solid lines show the critical and caustic curves at z = 2.236, respectively, obtained from the best-fitting lens model. The box indicates the size and position of the enlarged region in the rightmost panel. (c) CO(4–3) residual and contours at −2, +2 and +5σ. (d) Best-fit model of the CO source, truncated at its FWHM (yellow ellipse). The bar in the lower-right corner illustrates the physical scales at z = 2.236. Center row: (e) SMA 850 μm image in the extended configuration and −2, +2 and +5σ contours (black lines). The SMA beam is shown in the lower-left corner. (f) Best-fit model convolved with the SMA beam in the image plane. (g) 850 μm residual and contours at −2, +2 and +5σ. (h) Best-fit azimuthally-averaged model of the 850 μm source, truncated at its FWHM (red circle). Bottom row: (i,j,k) Same as before, for the HST F110W imaging, within the field-of-view indicated in panel (e). (l) Best-fit model of the rest-frame optical stellar continuum in the source plane (blue ellipse), compared with those of CO(4–3) and 850 μm continuum. We also show the direct ray-tracing of the WFC3 F110W emission to the source plane (dark blue contours drawn at +2, +3 and +4σ), and the highly elongated PSF of the WFC3 image in the source plane (dark blue ellipse in the lower-left corner).
Current usage metrics show cumulative count of Article Views (full-text article views including HTML views, PDF and ePub downloads, according to the available data) and Abstracts Views on Vision4Press platform.
Data correspond to usage on the plateform after 2015. The current usage metrics is available 48-96 hours after online publication and is updated daily on week days.
Initial download of the metrics may take a while.