Fig. 5.
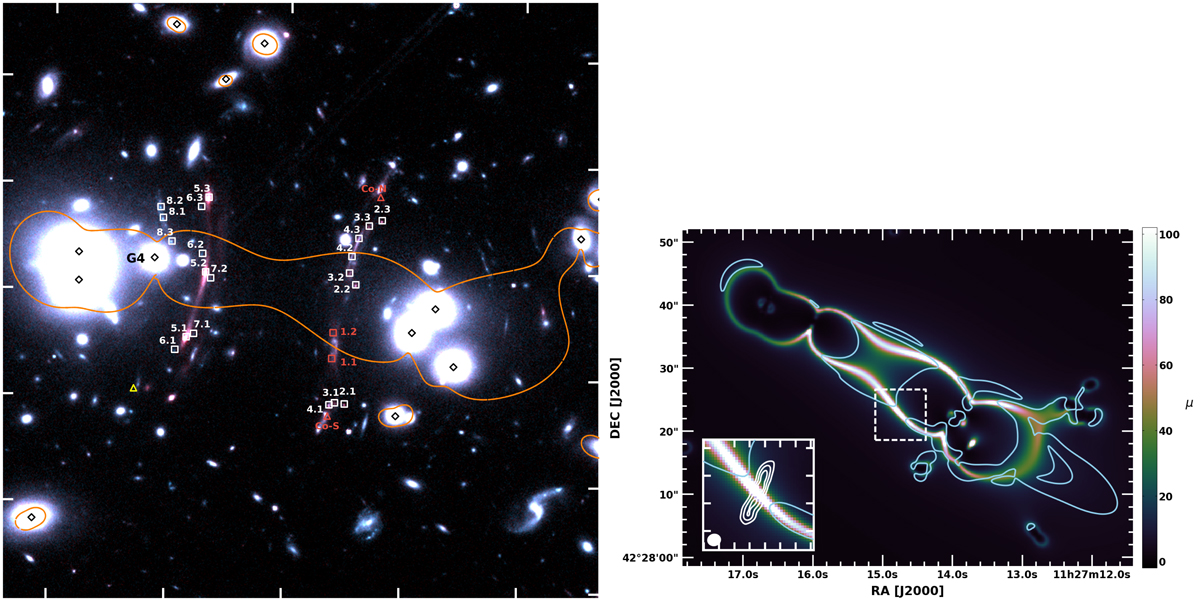
Left panel: As Fig. 1, with labels showing the multiple images identified for our gravitational lens modeling, either using IRAM CO(4–3) interferometry (red squares), or HST imaging (white squares). The yellow triangle indicates the position of the additional counter-image of system #8 predicted by the best-fit model. Right panel: Magnification map obtained for the best-fitting lens model, by taking the median of the maps generated by LENSTOOL for each MCMC realization. The inset shows the position of the SMA continuum emission from the Emerald (white contours, starting at +4σ and increasing in steps of +4σ). Cyan contours indicate areas where the average of the relative difference in magnification between the best-fit and each of the four alternative models is higher than 30%. The systematic errors induced by the different mass distributions in each model are much lower at the position of the Emerald thanks to the spectroscopic identification of the submm images.
Current usage metrics show cumulative count of Article Views (full-text article views including HTML views, PDF and ePub downloads, according to the available data) and Abstracts Views on Vision4Press platform.
Data correspond to usage on the plateform after 2015. The current usage metrics is available 48-96 hours after online publication and is updated daily on week days.
Initial download of the metrics may take a while.