Fig. 12.
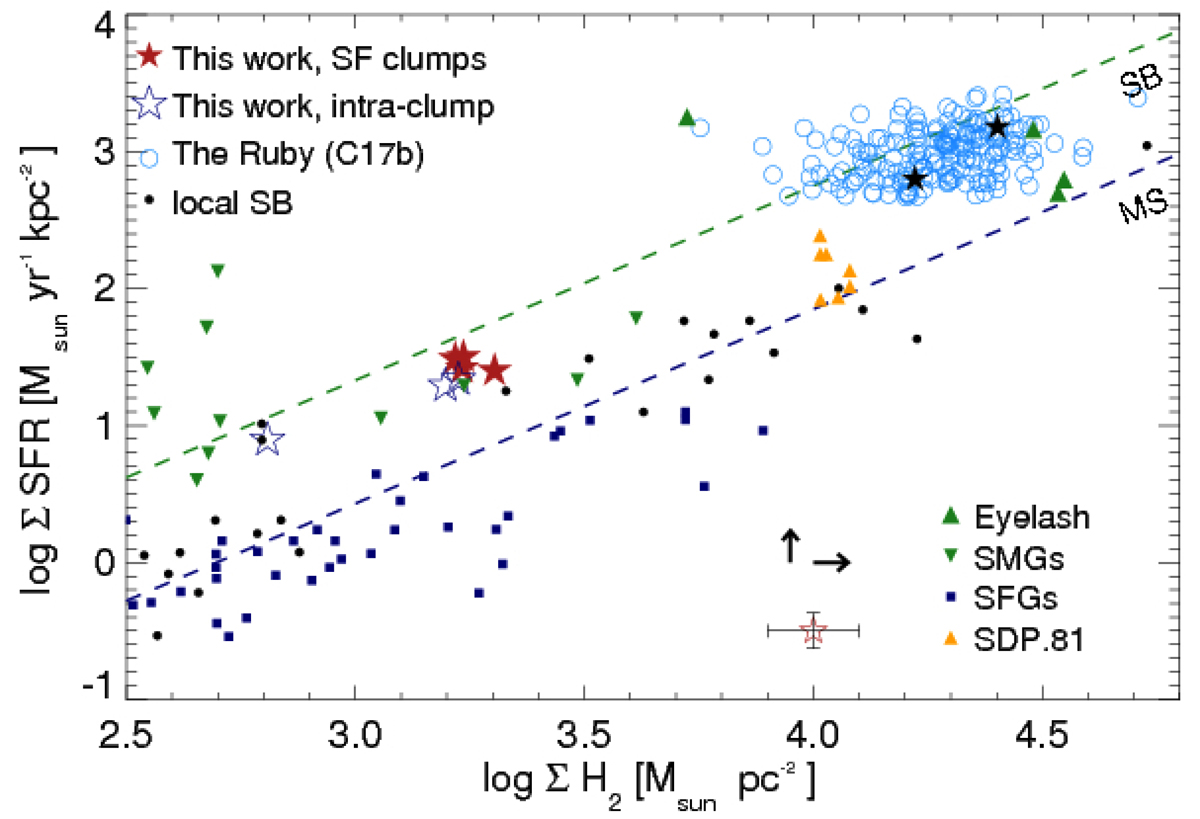
Spatially-resolved Schmidt–Kennicutt diagram in the Emerald, for the four star-forming clumps identified with CLUMPFIND (red stars) and the intraclump regions (open blue stars), the spatially resolved pixel-by-pixel analysis of the Ruby (light blue circles, Cañameras et al. 2017a) and its luminosity-weighted properties (black stars), and for other galaxy samples taken from the literature. These samples include spatially-resolved studies of the Eyelash (green triangles, Swinbank et al. 2011) and SDP.81 (yellow triangles, Hatsukade et al. 2015), submillimeter galaxies at z ∼ 2 (green upside-down triangles, Bothwell et al. 2010), normal star-forming galaxies at z = 1–2.3 (blue squares, Tacconi et al. 2010), and local starbursts (black circles, Kennicutt 1998). The dashed lines labeled “SB” and “MS” show the ridge lines of “starburst” and “main-sequence” galaxies of Daddi et al. (2010), respectively (see also Genzel et al. 2010). Typical error bars are shown in the lower-right corner. The small horizontal and vertical arrows indicate the expected offsets when using R4, 1 = 0.45 instead of 0.55, and the Salpeter stellar IMF instead of the Chabrier IMF, respectively (see text for details).
Current usage metrics show cumulative count of Article Views (full-text article views including HTML views, PDF and ePub downloads, according to the available data) and Abstracts Views on Vision4Press platform.
Data correspond to usage on the plateform after 2015. The current usage metrics is available 48-96 hours after online publication and is updated daily on week days.
Initial download of the metrics may take a while.