Fig. 10.
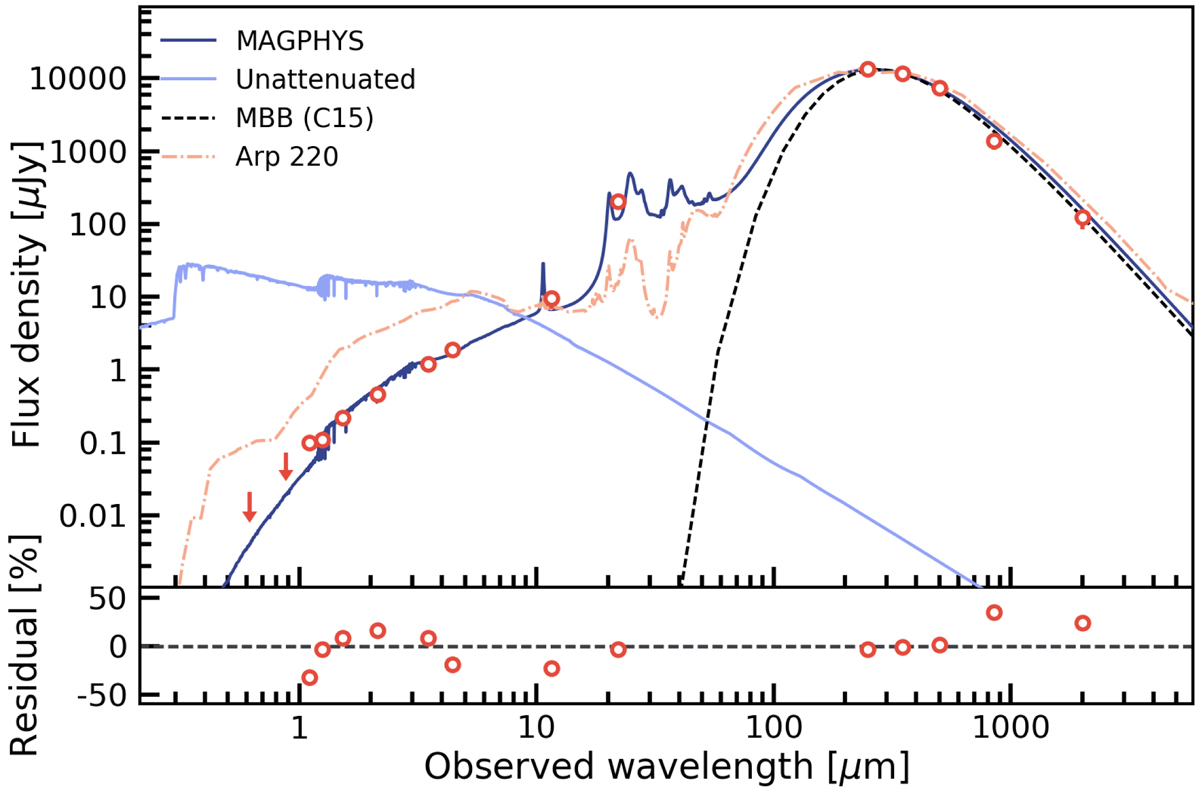
Top panel: intrinsic spectral energy distribution of the Emerald from the optical to the millimeter. Red circles show the photometry of the arc presented in Table 5, corrected for the gravitational magnification factors of the stellar and dust components, as described in the text. Flux uncertainties are smaller than the symbols and downward arrows show the 3σ upper limits on the MEGACAM fluxes. The best-fit SED to the full wavelength range obtained with MAGPHYS is plotted as a solid blue curve, and the best-fit stellar continuum without dust attenuation is shown in light blue. The dash-dotted orange line indicates the best-fit template of the local starburst galaxy Arp 220, shifted to z = 2.236 and normalized to the flux density of the Emerald in the 350 μm band of SPIRE. Bottom panel: residuals of the best-fitting MAGPHYS model.
Current usage metrics show cumulative count of Article Views (full-text article views including HTML views, PDF and ePub downloads, according to the available data) and Abstracts Views on Vision4Press platform.
Data correspond to usage on the plateform after 2015. The current usage metrics is available 48-96 hours after online publication and is updated daily on week days.
Initial download of the metrics may take a while.