Free Access
Fig. 5.
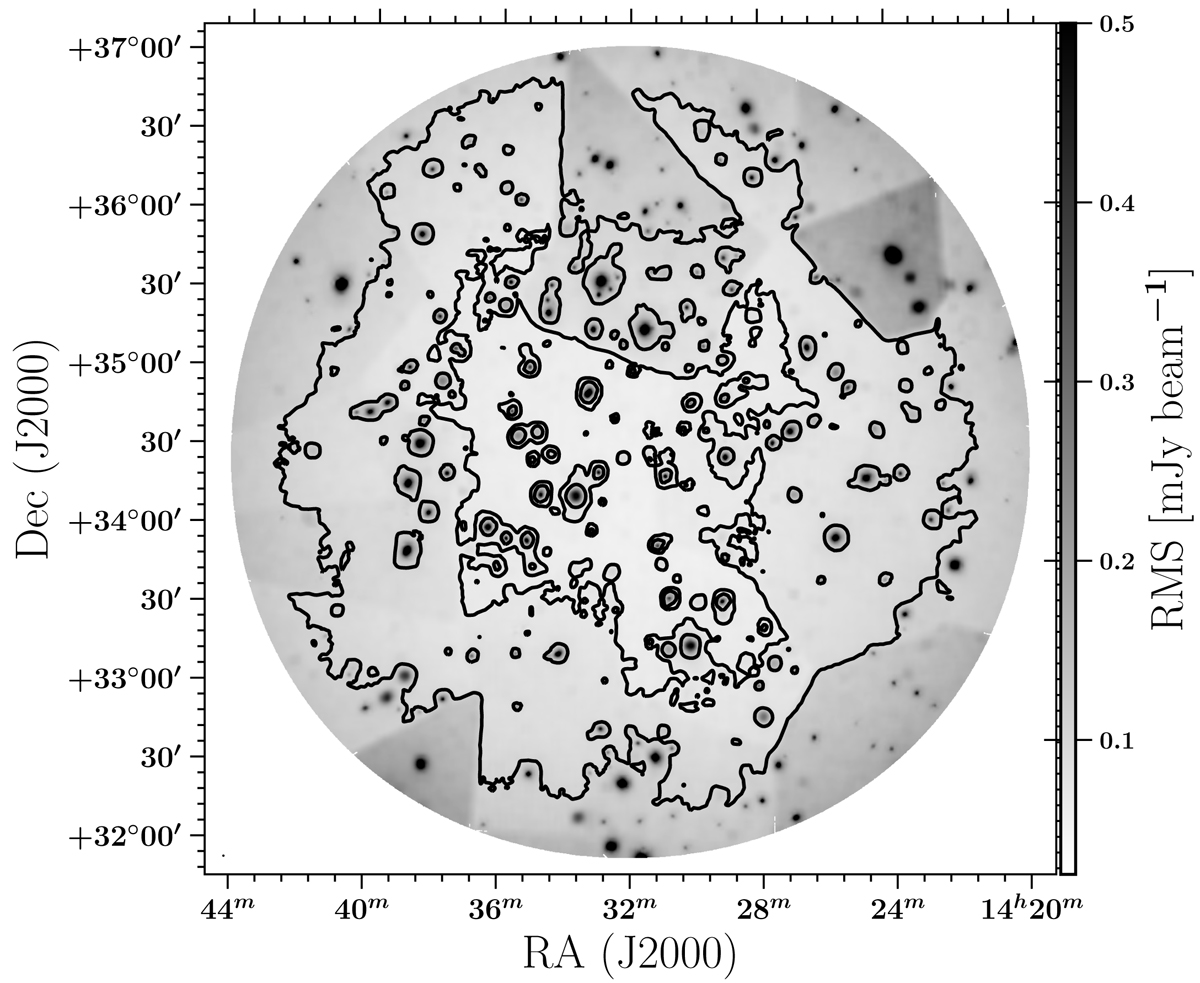
Noise map of the LOFAR 150 MHz mosaic of the Boötes field after primary beam correction. The color scale varies from 0.5σc to 9σc, where σc = 55 μJy beam−1 is the rms noise in the central region. Contours are plotted at 70 μJy beam−1 and 110 μJy beam−1.
Current usage metrics show cumulative count of Article Views (full-text article views including HTML views, PDF and ePub downloads, according to the available data) and Abstracts Views on Vision4Press platform.
Data correspond to usage on the plateform after 2015. The current usage metrics is available 48-96 hours after online publication and is updated daily on week days.
Initial download of the metrics may take a while.