Fig. 14.
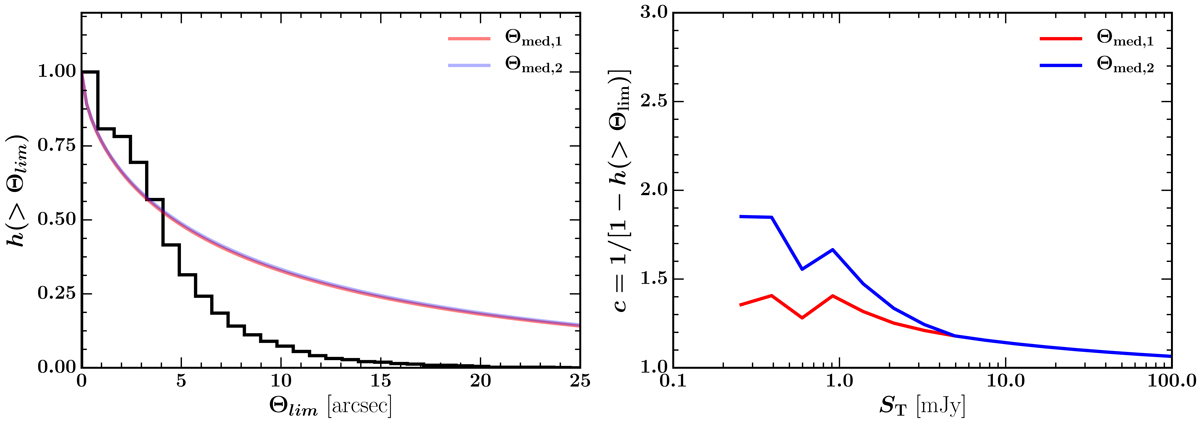
Left panel: integral size distribution (black lines) for sources in our catalog with 10 mJy < S150 MHz < 25 mJy. The red and blue lines represent the Windhorst et al. (1990) and Windhorst et al. (1993) relations scaled to 150 MHz and increased by a normalization factor of 2 for the corresponding median angular sizes. Right panel: resolution bias c = 1/[1−h(Θlim)] as a function of the total flux density. The color legends are the same as in the left panel.
Current usage metrics show cumulative count of Article Views (full-text article views including HTML views, PDF and ePub downloads, according to the available data) and Abstracts Views on Vision4Press platform.
Data correspond to usage on the plateform after 2015. The current usage metrics is available 48-96 hours after online publication and is updated daily on week days.
Initial download of the metrics may take a while.