Fig. 13.
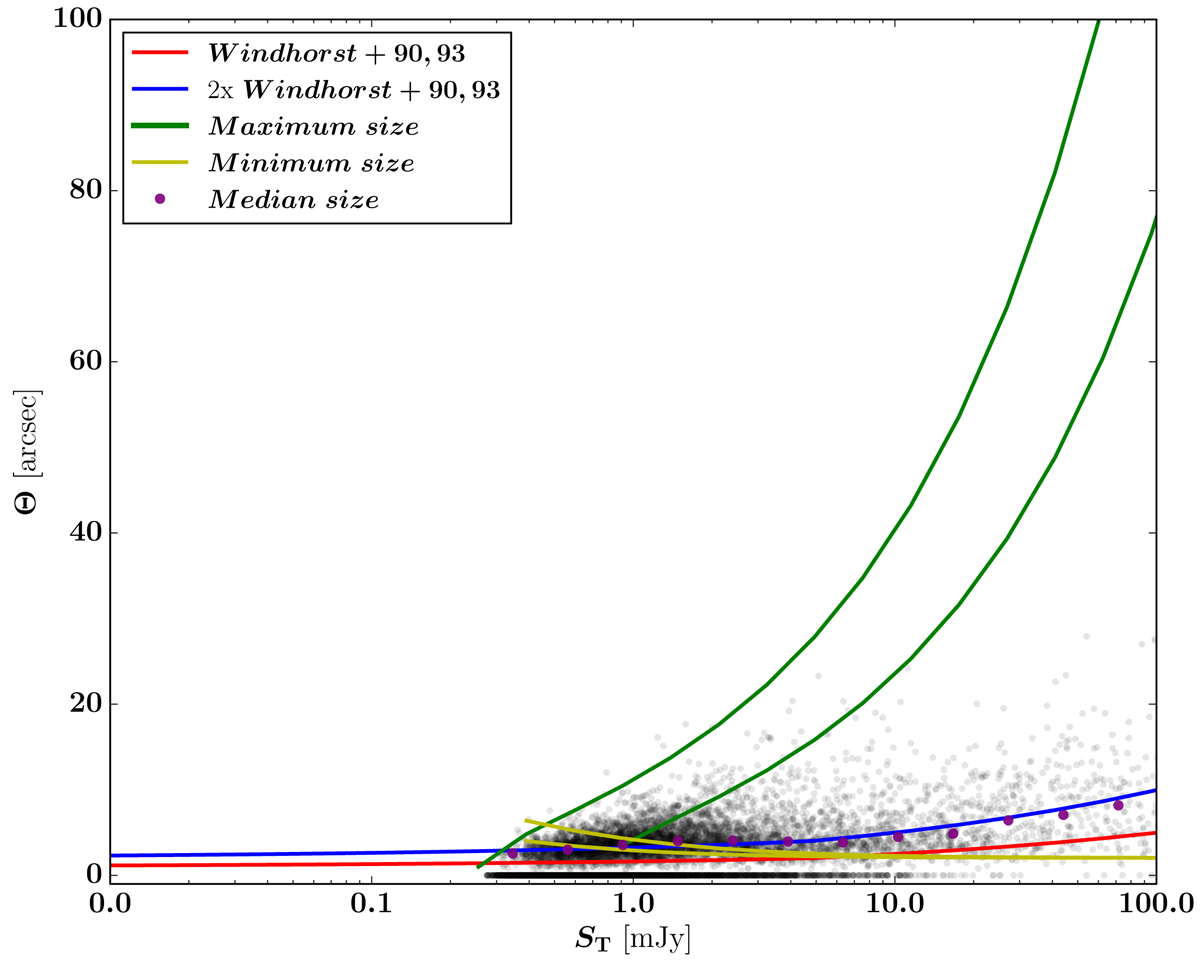
Angular size (deconvolved geometric mean) for LOFAR sources as function of their total flux density. The range of possible values for the maximum and minimum detectable angular sizes corresponding to the rms range in our mosaic (55 − 140 μJy) are indicated by the green and yellow lines, respectively. All unresolved sources are located in the plane Θ = 0, and the median source sizes for our sample are shown by purple points. The red line indicates the median of the Windhorst et al. (1990) functions, the blue line represents the same function increased by a normalization factor of 2.
Current usage metrics show cumulative count of Article Views (full-text article views including HTML views, PDF and ePub downloads, according to the available data) and Abstracts Views on Vision4Press platform.
Data correspond to usage on the plateform after 2015. The current usage metrics is available 48-96 hours after online publication and is updated daily on week days.
Initial download of the metrics may take a while.