Fig. 12.
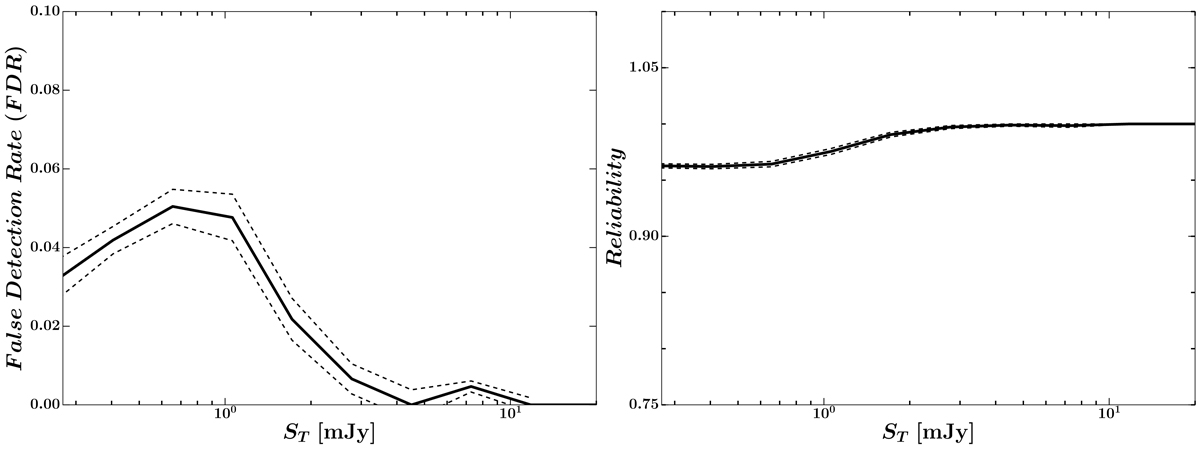
Left panel: false detection rate (FDR) as a function of flux density. For ST < 1 mJy, the FDR is less than 5 percent, while there are not false detections for ST > 5 mJy. Right panel: reliability function of our Boötes catalog as a function of flux density. The dashed lines in both plots represent 1σ errors estimated using Poisson statistics.
Current usage metrics show cumulative count of Article Views (full-text article views including HTML views, PDF and ePub downloads, according to the available data) and Abstracts Views on Vision4Press platform.
Data correspond to usage on the plateform after 2015. The current usage metrics is available 48-96 hours after online publication and is updated daily on week days.
Initial download of the metrics may take a while.