Free Access
Fig. 10.
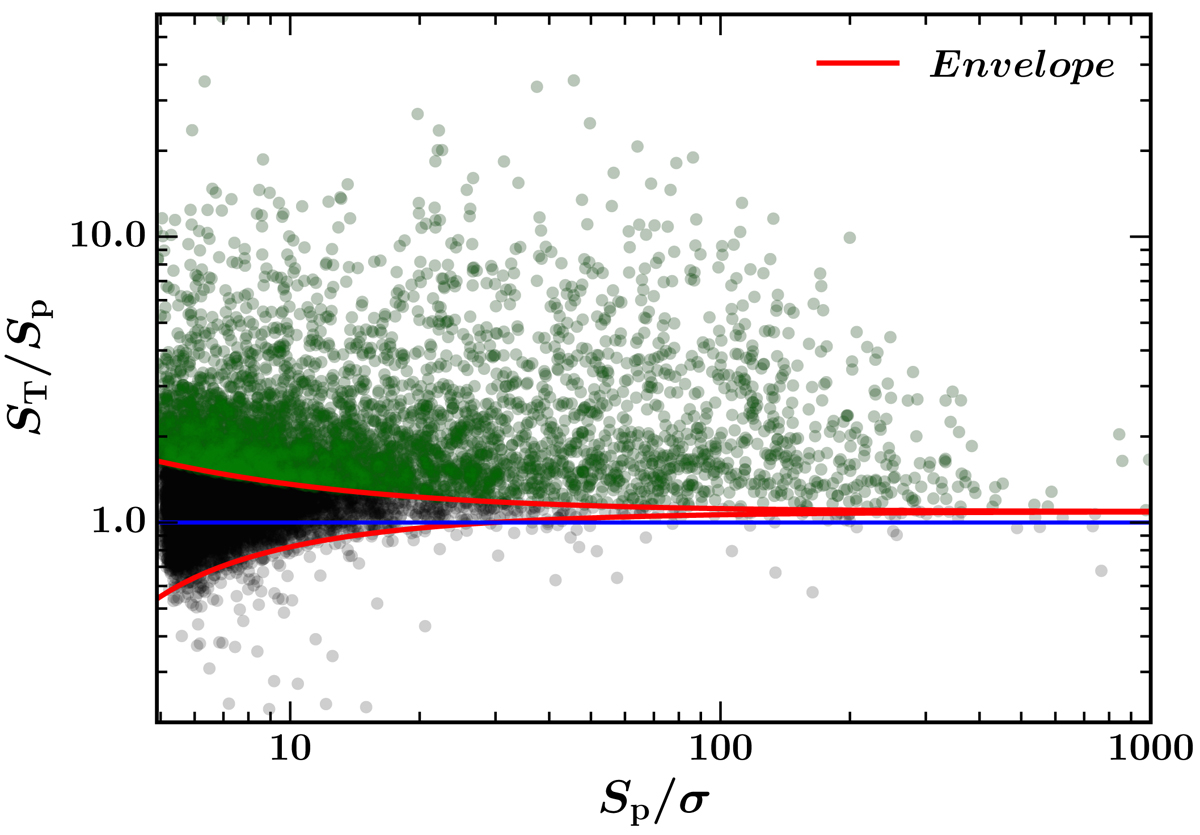
Ratio of the total flux density ST to peak flux density SP as a function of S/N (SP/σ) for all sources in our catalog. The red lines indicate the lower and upper envelopes. The blue line denotes the ST = SP axis. Sources (green circles) that lie above the upper envelope are considered to be resolved.
Current usage metrics show cumulative count of Article Views (full-text article views including HTML views, PDF and ePub downloads, according to the available data) and Abstracts Views on Vision4Press platform.
Data correspond to usage on the plateform after 2015. The current usage metrics is available 48-96 hours after online publication and is updated daily on week days.
Initial download of the metrics may take a while.