Fig. 1.
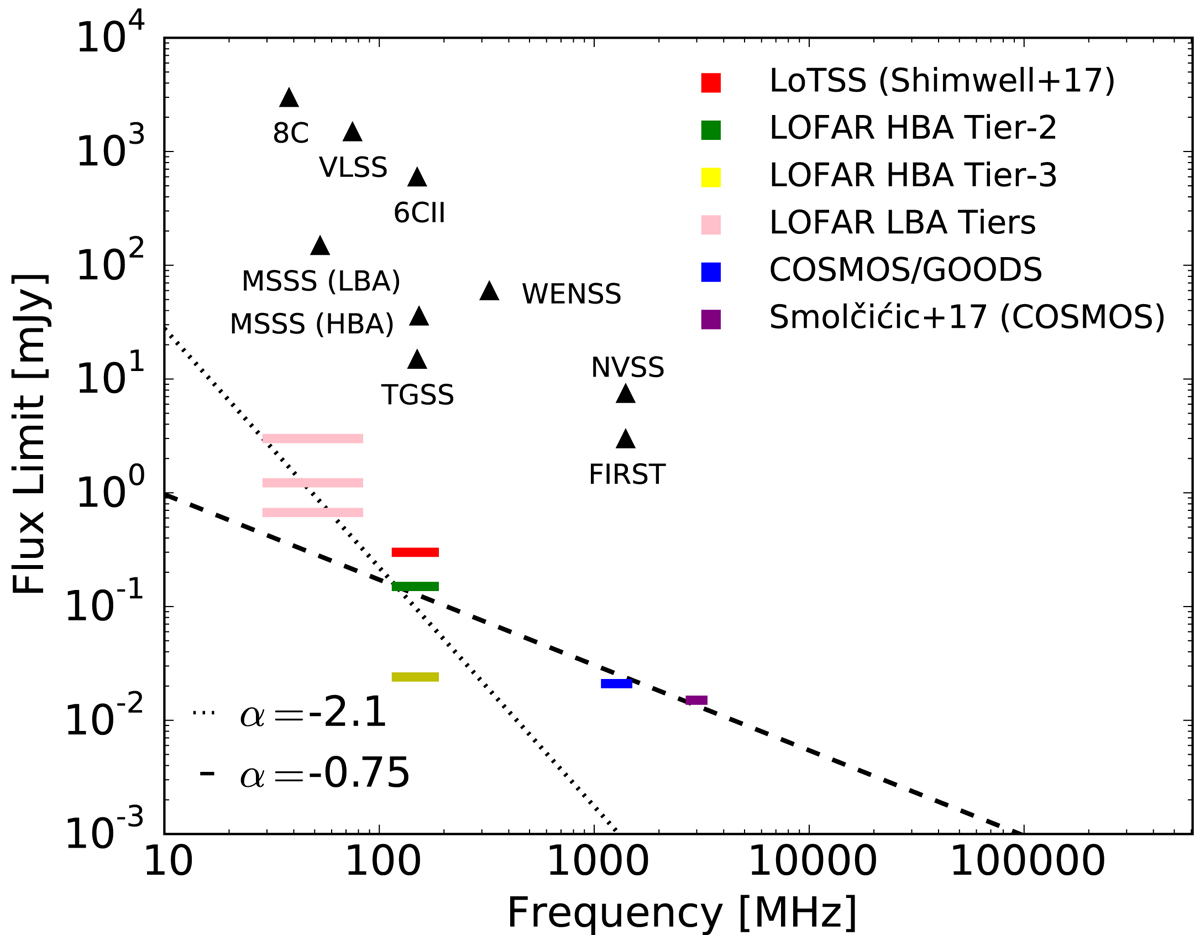
Comparison between two radio sources with the same flux, but different spectral indices. The black triangles denote the 5σ flux density limits for previous all-sky shallow low- and high- frequency surveys (Hales et al. 1988; Becker et al. 1995; Condon et al. 1998; Rengelink et al. 1997; Cohen et al. 2007; Heald et al. 2015; Intema et al. 2017), while color bars indicate the 3 different tiers for LOFAR surveys using the LOFAR Low band antennas (LBA) and High band antennas (HBA), and the deepest high-frequency surveys currently published (Schinnerer et al. 2010; Miller et al. 2013; Smolčić et al. 2017a). Sources steeper than α = −2.1 will be detected at higher signifcance in the Tier-2/Tier-3 surveys than in deep high-frequency surveys, while sources flatter than α = −0.75 at detected at both low and high frequencies.
Current usage metrics show cumulative count of Article Views (full-text article views including HTML views, PDF and ePub downloads, according to the available data) and Abstracts Views on Vision4Press platform.
Data correspond to usage on the plateform after 2015. The current usage metrics is available 48-96 hours after online publication and is updated daily on week days.
Initial download of the metrics may take a while.