Fig. 6
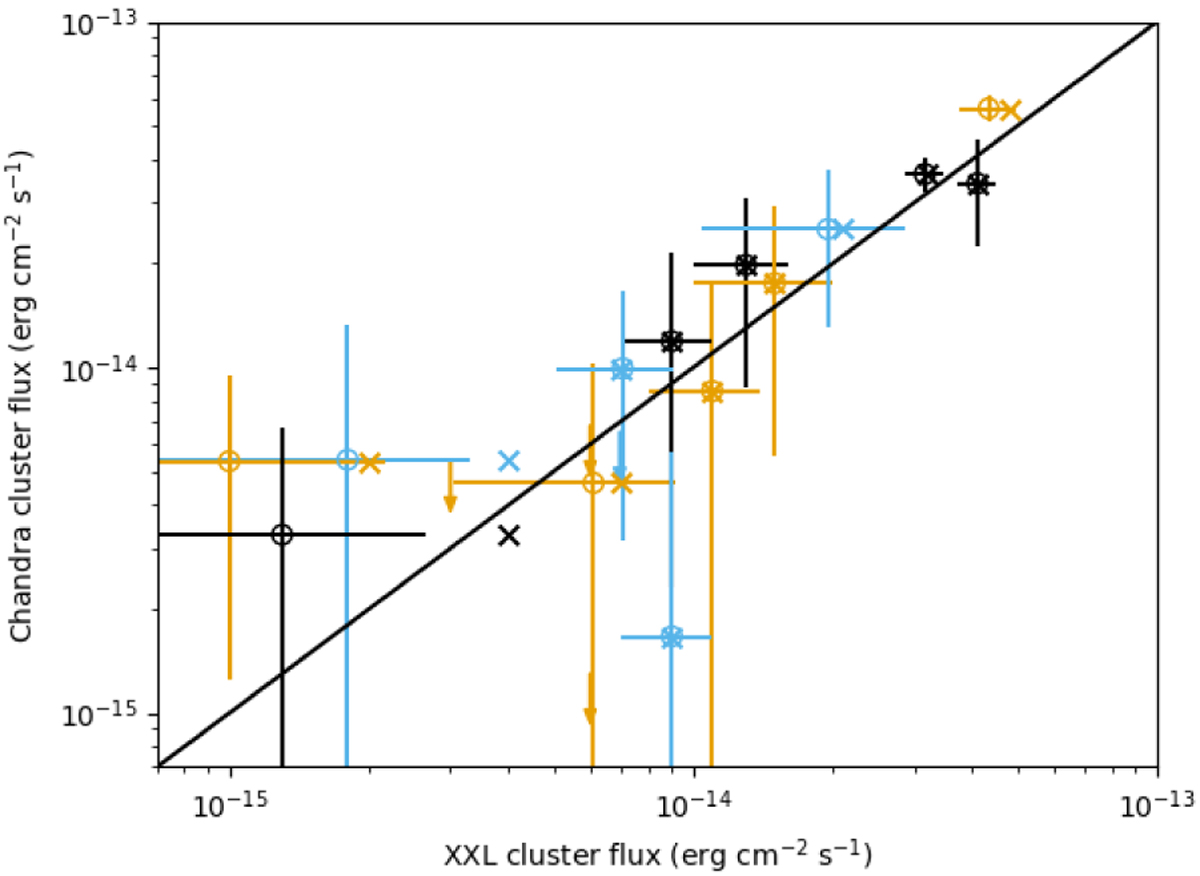
Chandra cluster flux versus the XXL cluster flux, F60. C1 clusters are black circles/crosses/arrows, C2s are yellow circles/crosses/arrows, and C3s are blue circles/crosses/arrows. The crosses are F60 as listed in Col. 4 of Table 2 (i.e. the original flux, not excluding the point sources detected by Chandra). The circles are the F60 minus theflux from any point source detected in the Chandra data that was not previously resolved by XXL data (listed in Col. 6 of Table 2). The solid line is a line of equality. The arrows indicate upper limits on the Chandra cluster flux – the tip of the arrow denotes the upper limit and are plotted against the point source corrected XXL flux. 3XLSS J022059.0-043922 and 3XLSS J022554.3-045059 are not shown on the plot as the Chandra point source flux is greater than F60.
Current usage metrics show cumulative count of Article Views (full-text article views including HTML views, PDF and ePub downloads, according to the available data) and Abstracts Views on Vision4Press platform.
Data correspond to usage on the plateform after 2015. The current usage metrics is available 48-96 hours after online publication and is updated daily on week days.
Initial download of the metrics may take a while.