Fig. 4
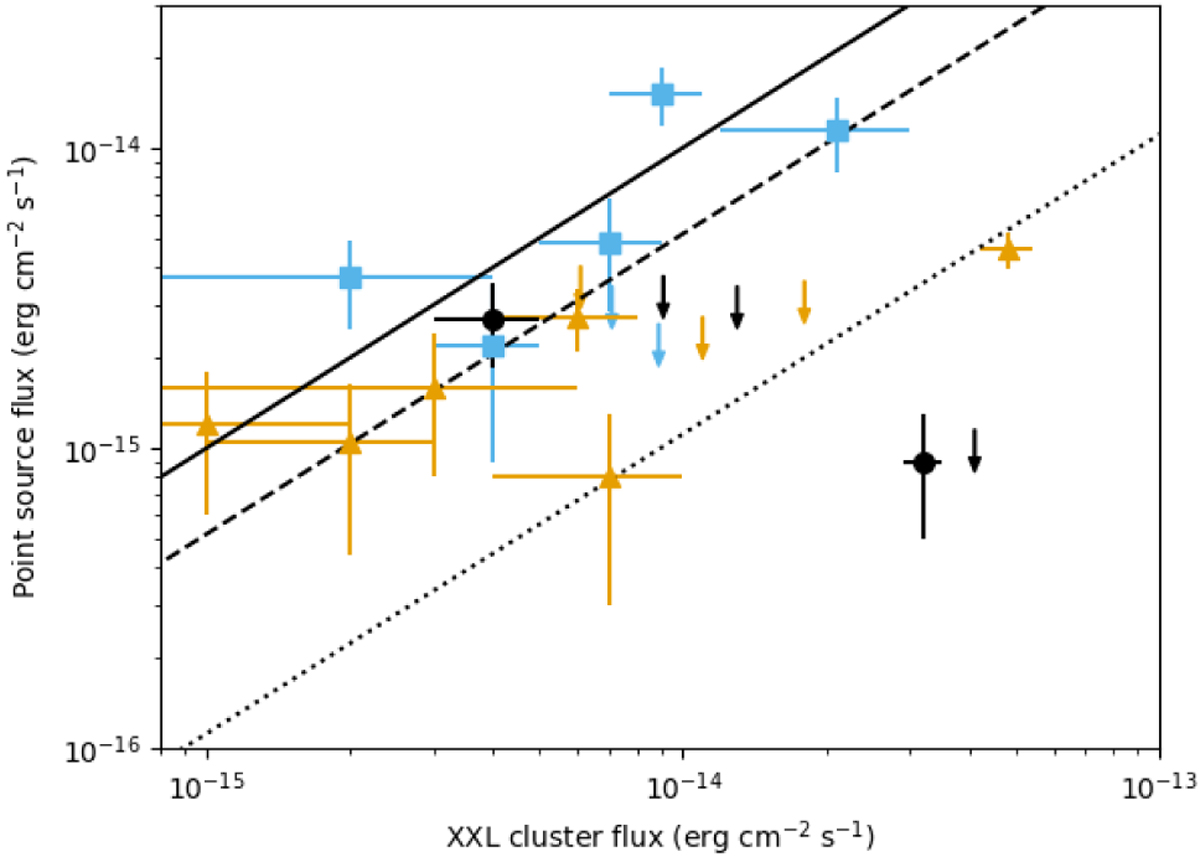
Total Chandra flux for point sources within 60′′ of the cluster centre versus the XMM cluster flux. C1 clusters are black circles, C2s are yellow triangles and C3s are blue squares. Arrows indicate clusters that only have a 1σ upper limit for their point source flux (Col. 6 in Table 2) – the tip of the arrow denotes the upper limit. The solid straight line is a line of equality showing locus of 100% AGN contamination and the dashed and dotted lines are lines of equality showing the locus of 50% and 10% AGN contamination, respectively. 1σ errors are shown.
Current usage metrics show cumulative count of Article Views (full-text article views including HTML views, PDF and ePub downloads, according to the available data) and Abstracts Views on Vision4Press platform.
Data correspond to usage on the plateform after 2015. The current usage metrics is available 48-96 hours after online publication and is updated daily on week days.
Initial download of the metrics may take a while.