Fig. 1
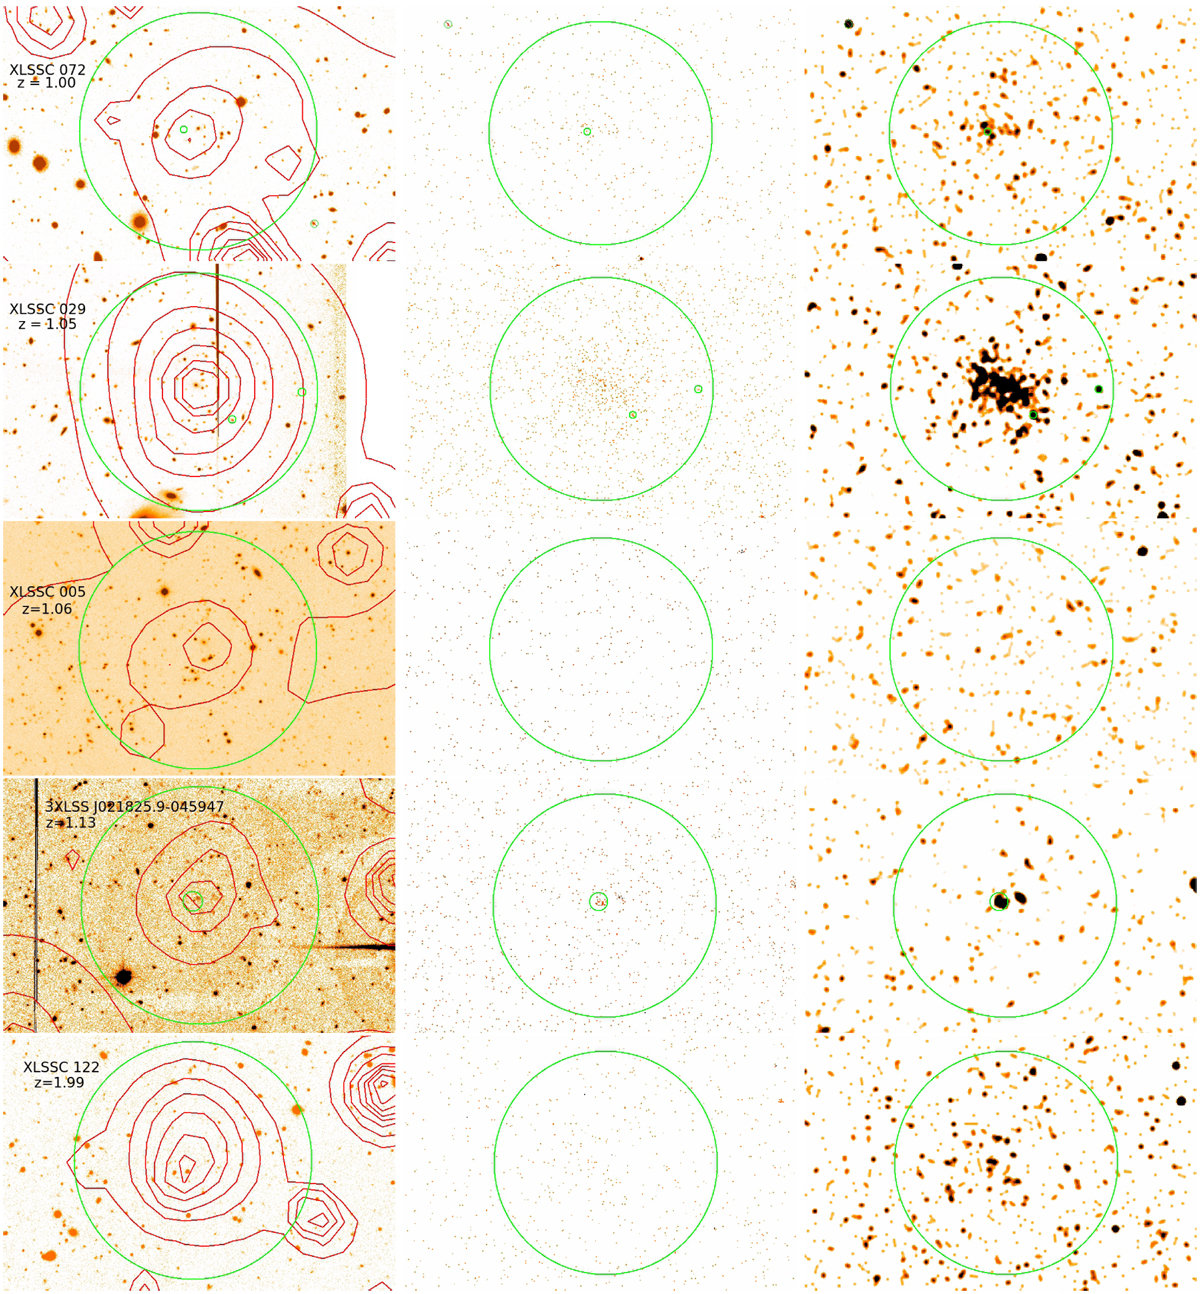
A comparison of the optical image with the XMM-Newton contours from the 0.5–2 keV band (red) superimposed (left panel) and the raw and smoothed (using a Gaussian with σ ~ 2.5″) Chandra (centre and right panels, respectively) images for all C1 clusters. All optical images are i-band images from the CFHTLS except for 3XLSS J021825.9-045947 which is r-band. Chandra images are in the 0.3–8.0 keV band. The green circle is the same in all images and is of radius 60″ and centred on the cluster centre. Point sources within 60″ of the cluster centre are marked by the smaller green circles in all images. In the raw Chandra images, if a Chandra point sourcewas detected in XXL, then it is circled in red.
Current usage metrics show cumulative count of Article Views (full-text article views including HTML views, PDF and ePub downloads, according to the available data) and Abstracts Views on Vision4Press platform.
Data correspond to usage on the plateform after 2015. The current usage metrics is available 48-96 hours after online publication and is updated daily on week days.
Initial download of the metrics may take a while.