Free Access
Fig. 4
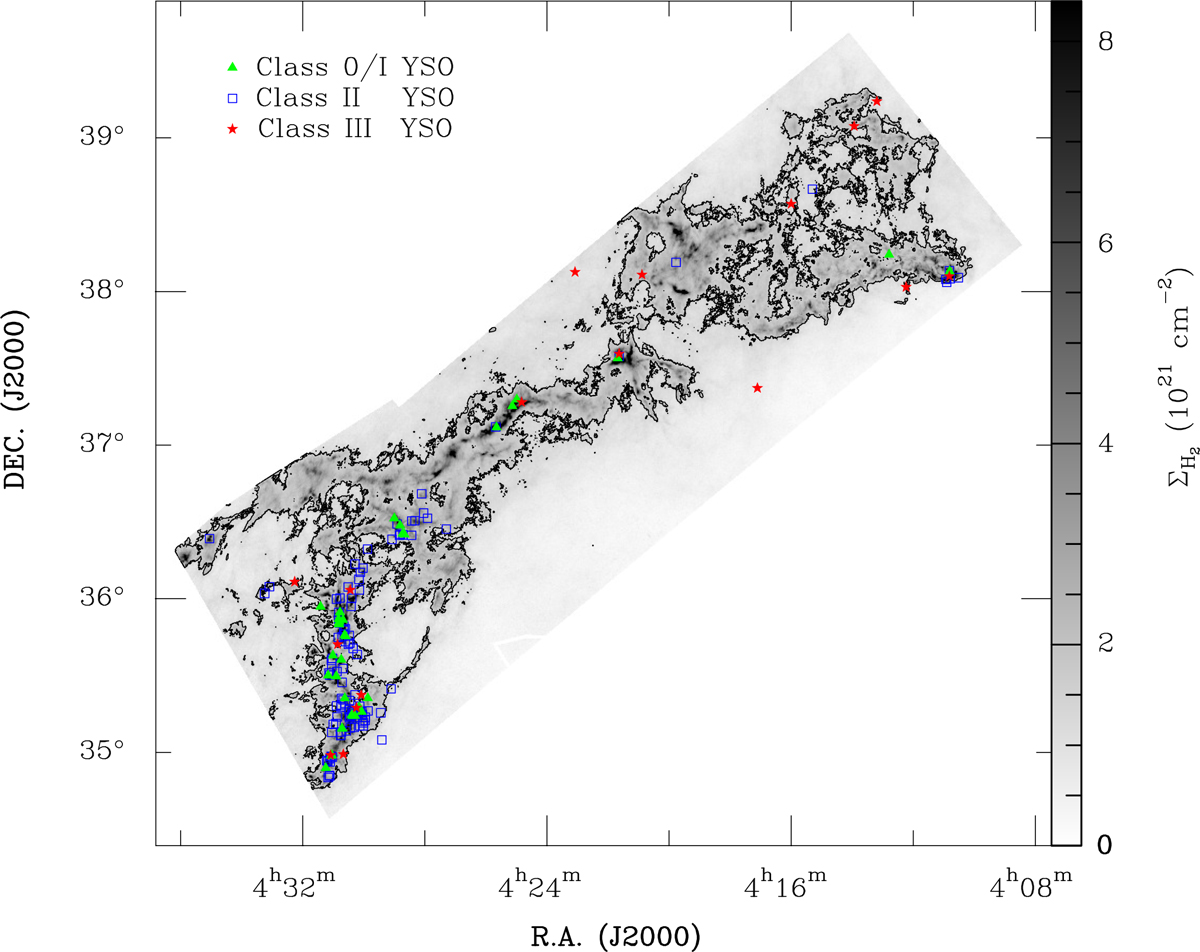
Distribution of YSOs in the Herschel H2 column density map. This map is shown from 0 to 10% of the peak value (8.4 × 1022 cm−2). The noise σ is 0.5 × 1021cm−2 estimated in the region from off-sources. The black contour is 3σ.
Current usage metrics show cumulative count of Article Views (full-text article views including HTML views, PDF and ePub downloads, according to the available data) and Abstracts Views on Vision4Press platform.
Data correspond to usage on the plateform after 2015. The current usage metrics is available 48-96 hours after online publication and is updated daily on week days.
Initial download of the metrics may take a while.