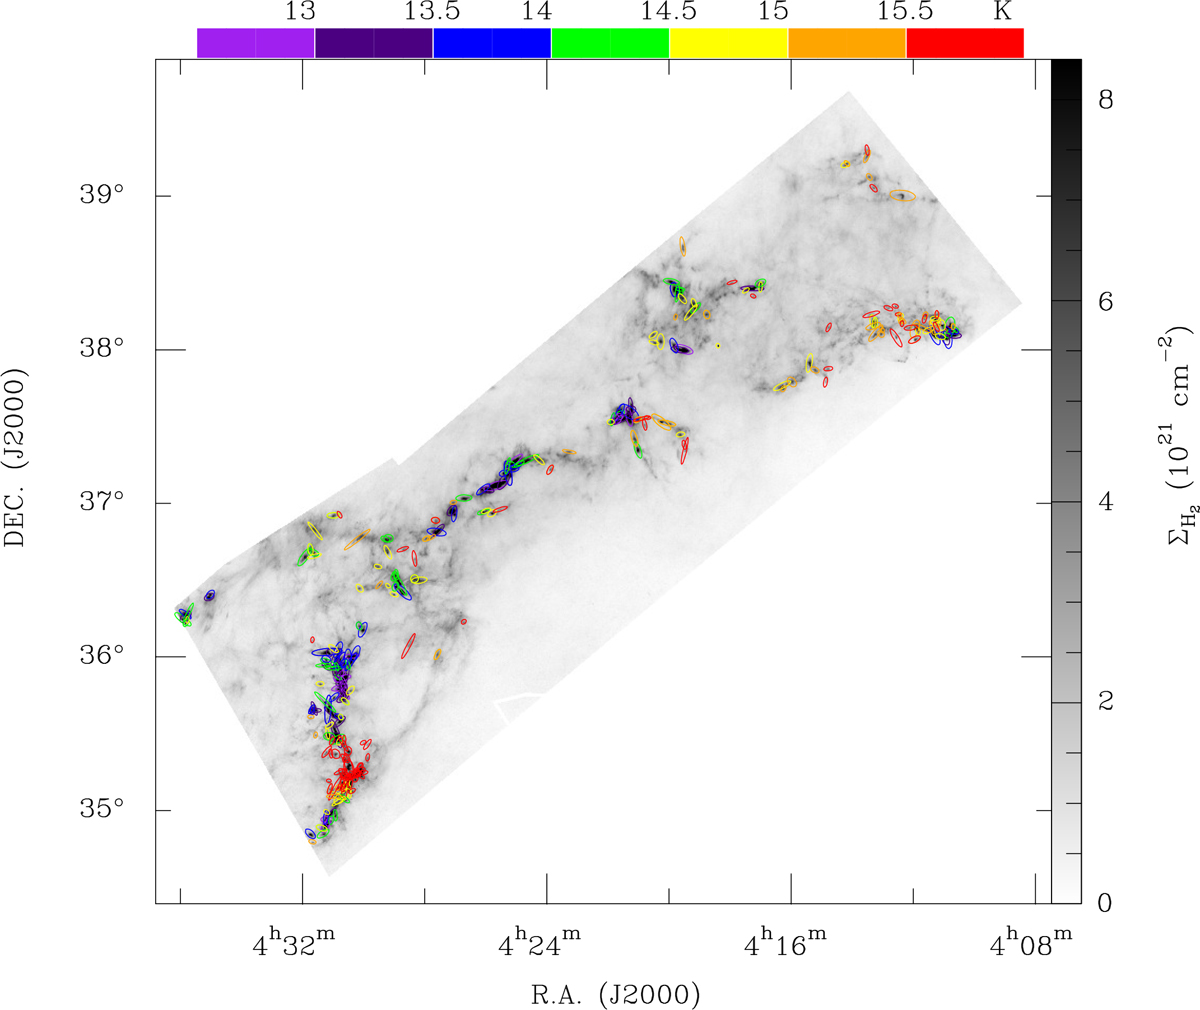
Fig. 3

Three hundred cores in the California molecular cloud plotted in the H 2 column density map. This map is shown from 0 to 10% of the peak value (8.4 × 1022 cm−2). The cores are displayed with the measured dust temperature in units of K, coded as shown in the color bar on the top. The major and minor axes of the core ellipse shape in this map are 4 FWHMs of the equivalent Gaussian.
Current usage metrics show cumulative count of Article Views (full-text article views including HTML views, PDF and ePub downloads, according to the available data) and Abstracts Views on Vision4Press platform.
Data correspond to usage on the plateform after 2015. The current usage metrics is available 48-96 hours after online publication and is updated daily on week days.
Initial download of the metrics may take a while.


