Fig. 2
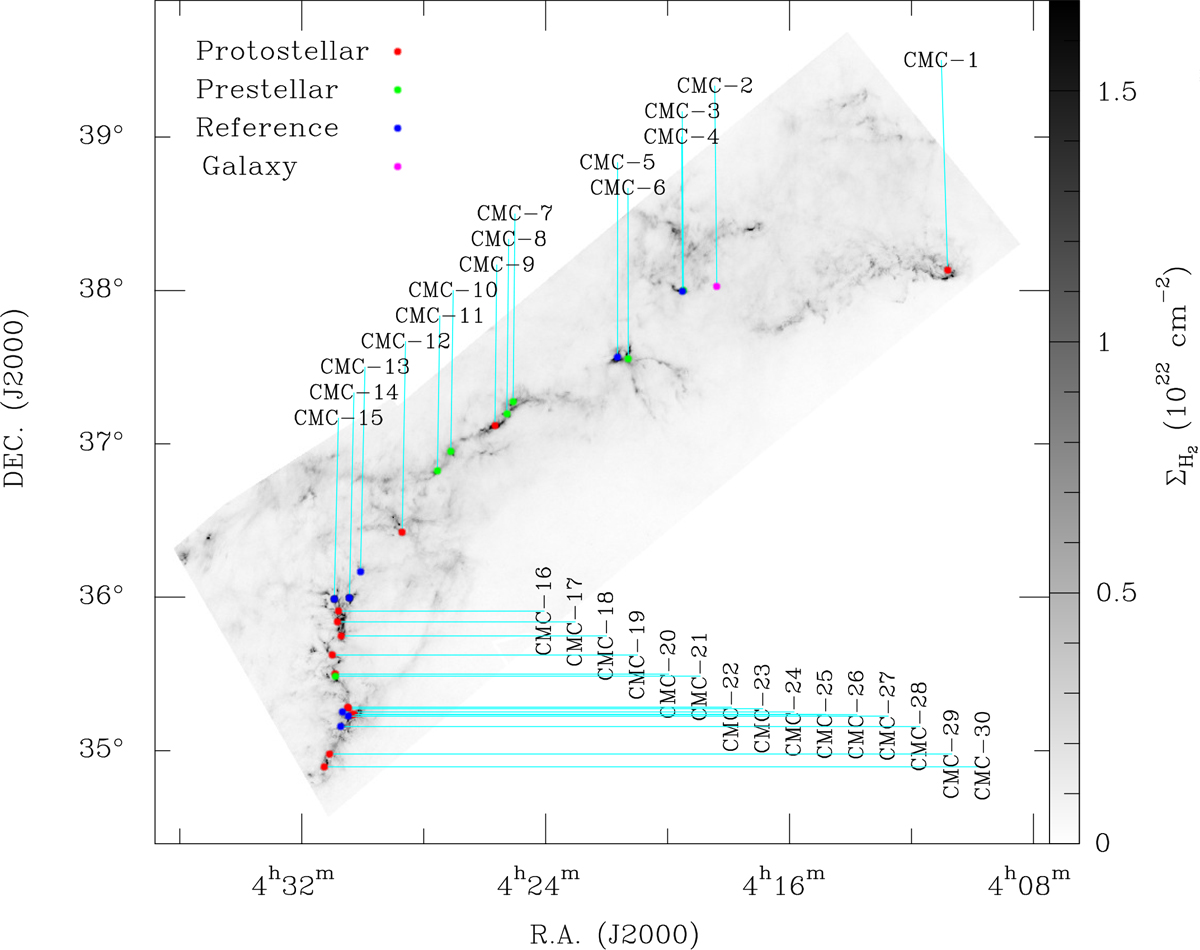
Thirty positions for the IRAM 30m single-pointing observations on the Herschel H 2 column density map. This map is shown from 0 to 20% of the peak value (8.4 × 1022 cm−2). The 500 μm beam is 36.3′′. The 30 observation positions are along the main filament in the CMC. The 14 protostellar cores are plotted with red solid circles, the seven prestellar cores are plotted with green solid circles, the eight observation positions are reference positions that are offset from the cores plotted with blue solid circles, and one position is projected on galaxy 3C111, plotted withpink solid circle.
Current usage metrics show cumulative count of Article Views (full-text article views including HTML views, PDF and ePub downloads, according to the available data) and Abstracts Views on Vision4Press platform.
Data correspond to usage on the plateform after 2015. The current usage metrics is available 48-96 hours after online publication and is updated daily on week days.
Initial download of the metrics may take a while.