Free Access
Fig. A.1
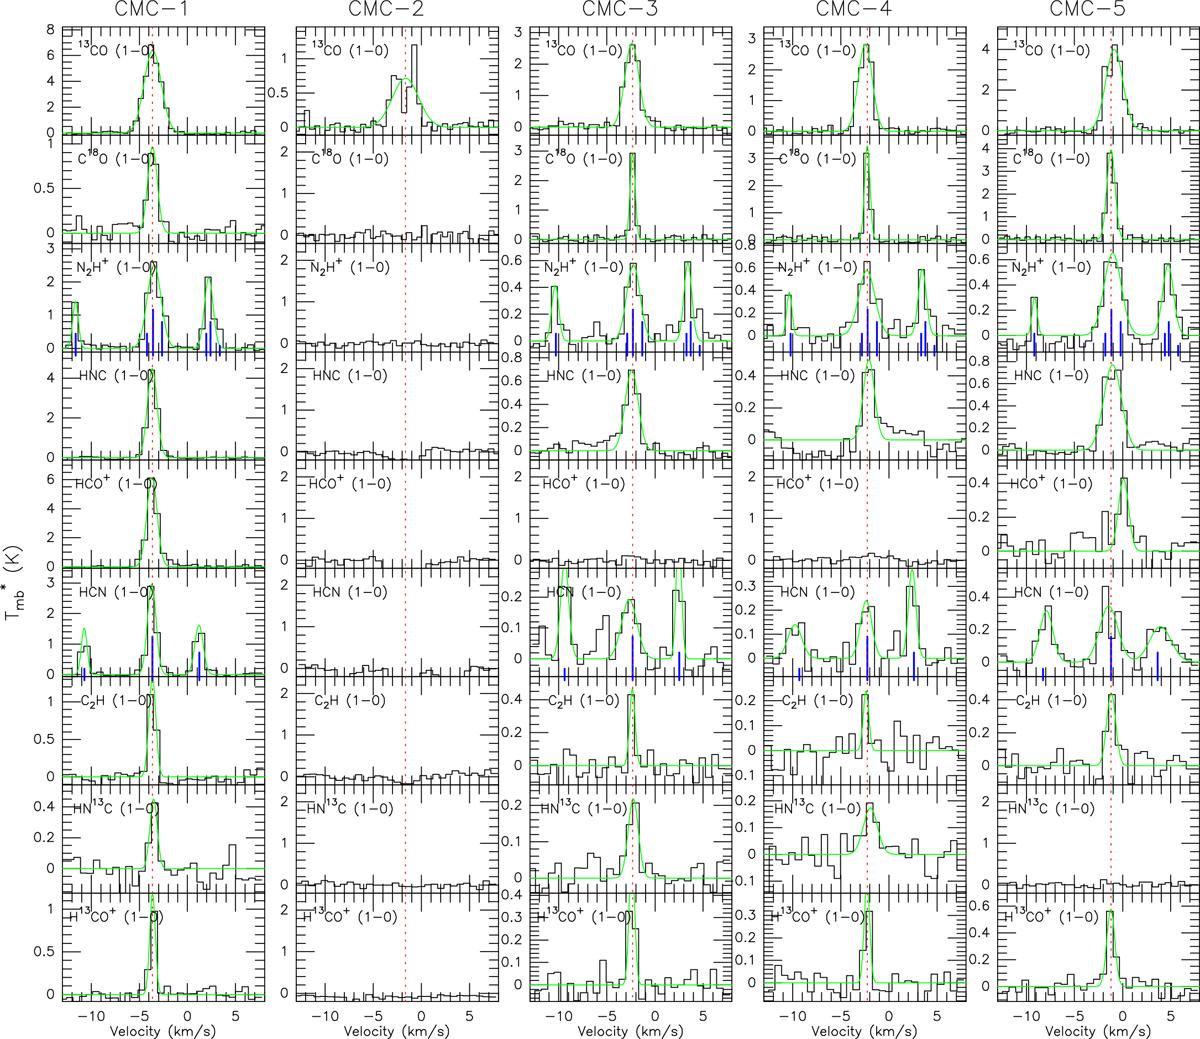
Thirty molecular lines of the IRAM 30m observation point. The green curves indicate the Gauss-fit profile. The red dashed lines mark the position of the local standard of rest velocity. The blue lines mark the position of the N 2 H + (1−0) and HCN(1−0) hyperfine structure.
Current usage metrics show cumulative count of Article Views (full-text article views including HTML views, PDF and ePub downloads, according to the available data) and Abstracts Views on Vision4Press platform.
Data correspond to usage on the plateform after 2015. The current usage metrics is available 48-96 hours after online publication and is updated daily on week days.
Initial download of the metrics may take a while.