Fig. 12
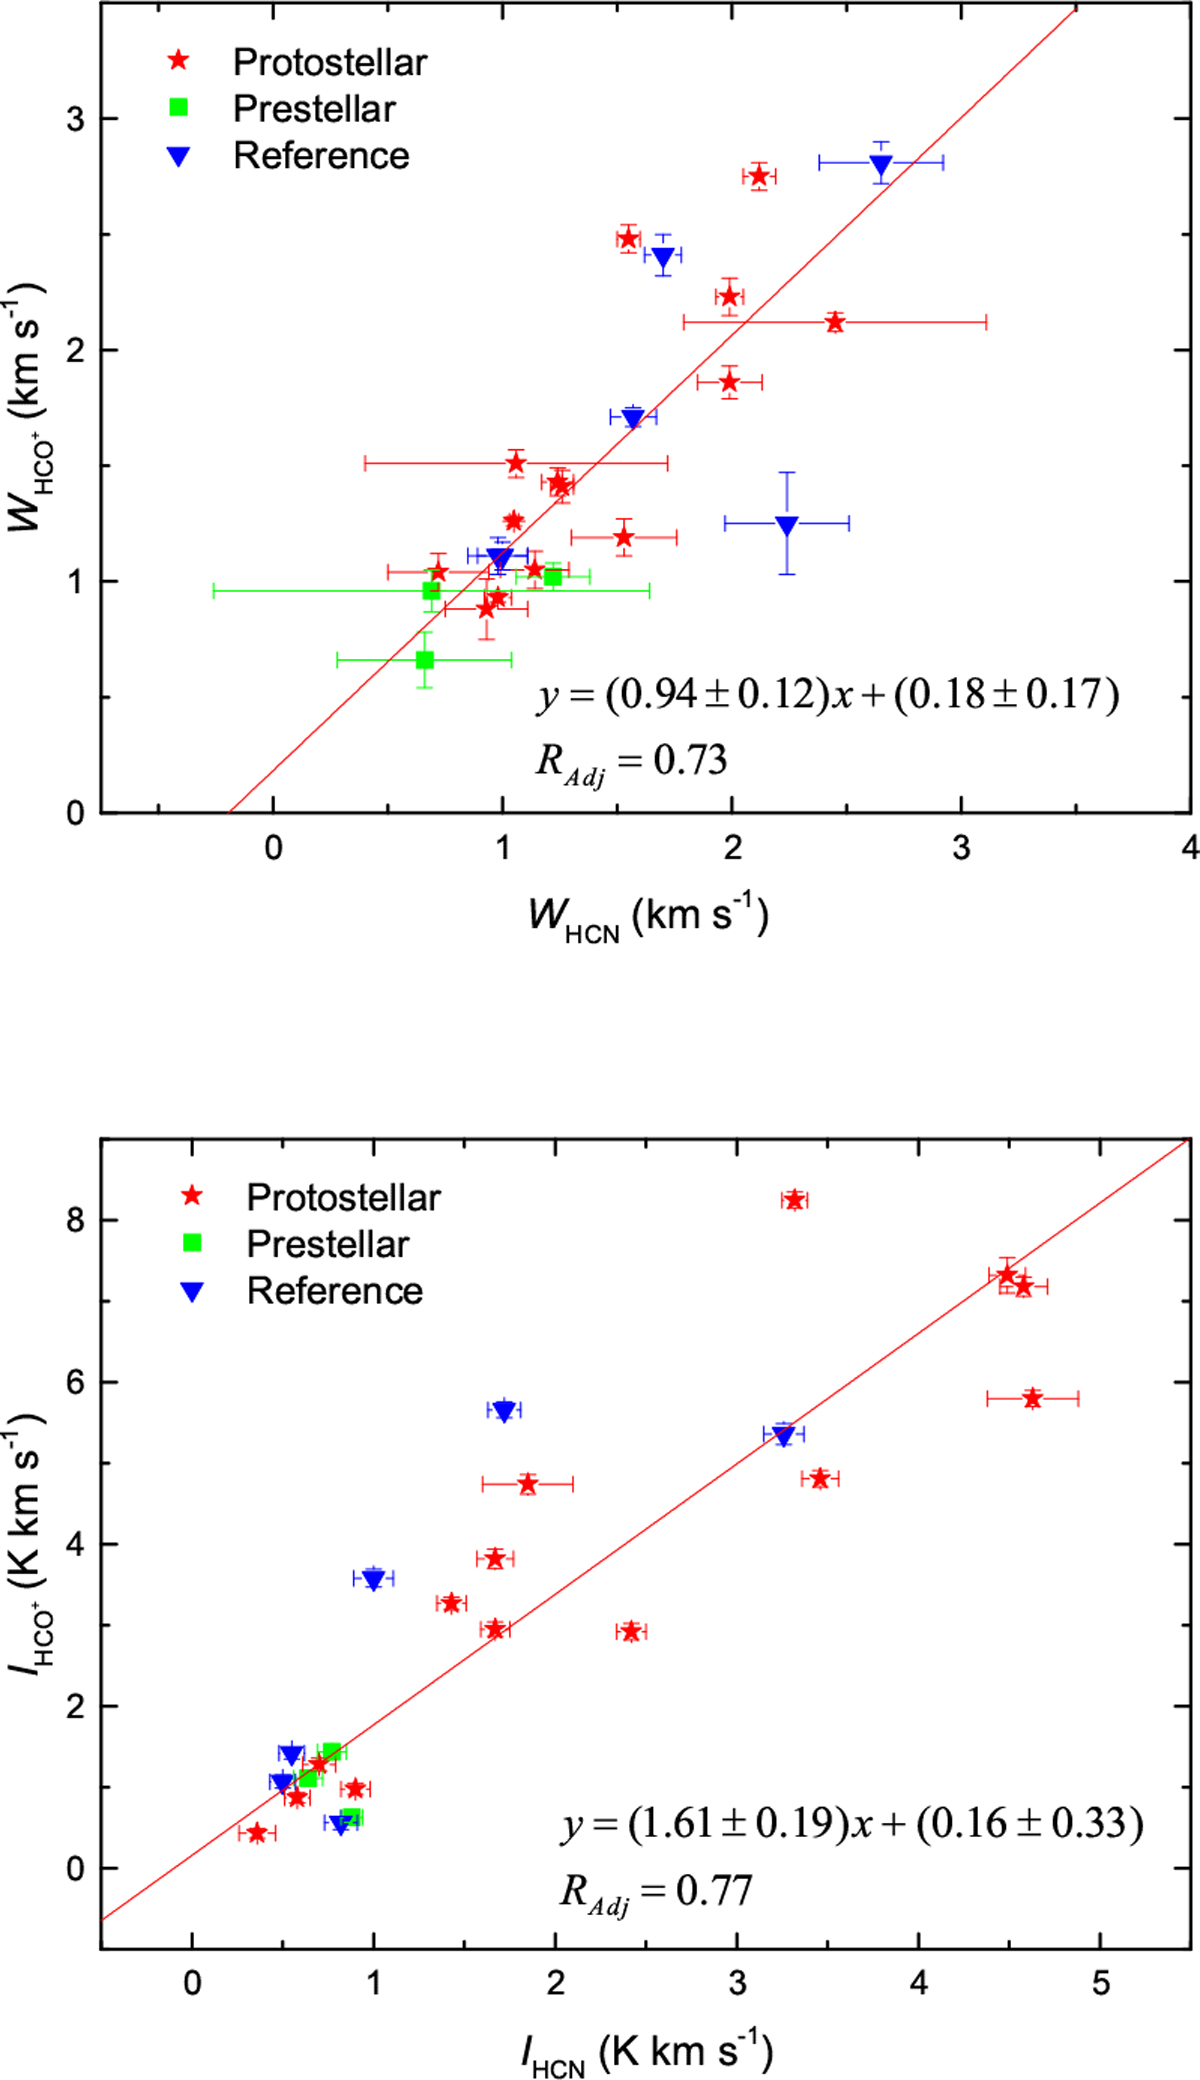
Line widths and velocity-integrated intensities of HCN and HCO+. They follow strong linear relationships, which indicate that HCN and HCO+ couple well and there are tight chemical connections. The 14 protostellar cores are plotted with red stars, the seven prestellar cores are plotted with green boxes, and the eight observation positions are reference positions that are offset from the cores. They are plotted with blue inverted triangles.
Current usage metrics show cumulative count of Article Views (full-text article views including HTML views, PDF and ePub downloads, according to the available data) and Abstracts Views on Vision4Press platform.
Data correspond to usage on the plateform after 2015. The current usage metrics is available 48-96 hours after online publication and is updated daily on week days.
Initial download of the metrics may take a while.