Fig. 11
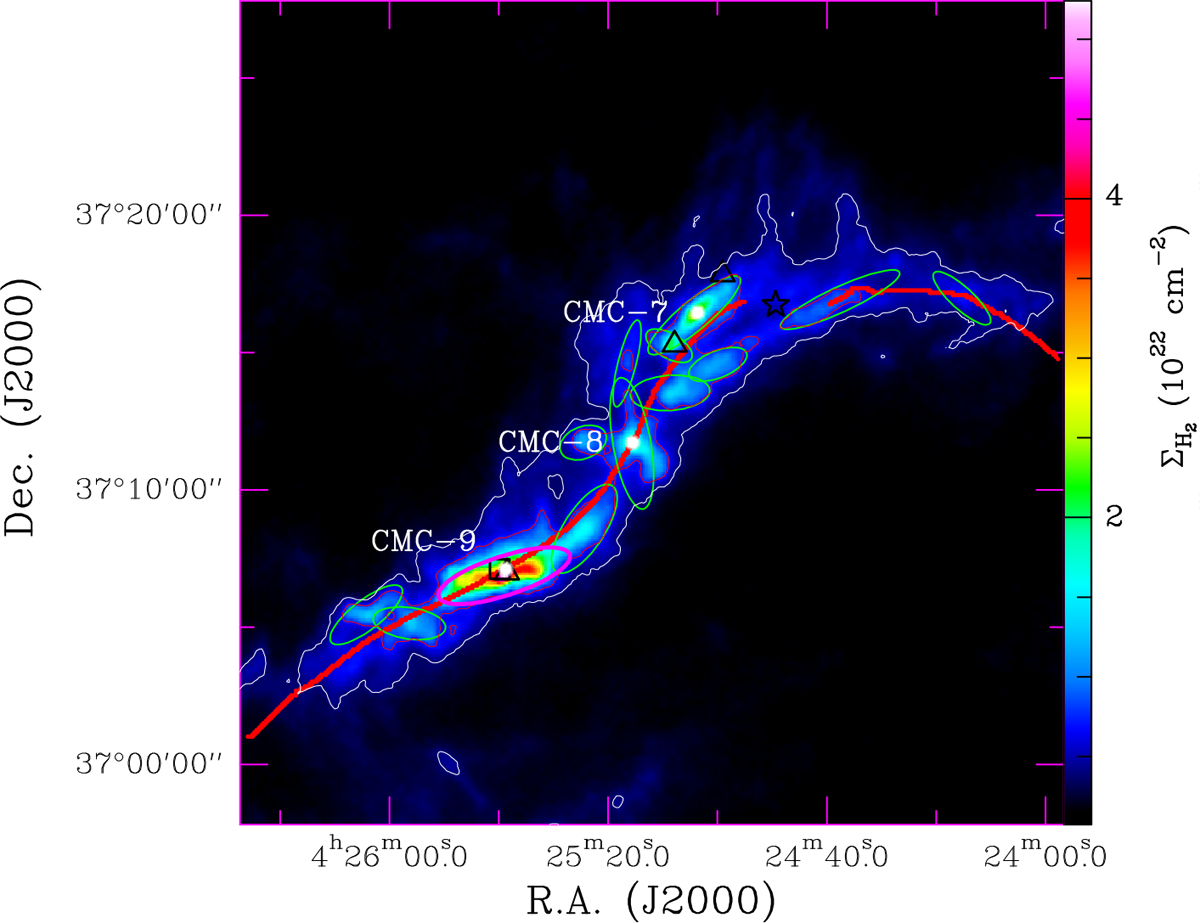
Filament existing high-mass core. σ = 1.3 × 1021cm−2 is the noise estimated in the local region from off-sources. The white contour is 3σ. The pink contour is the average surface density threshold for efficient star formation, 116 M⊙ pc−2 (Lada et al. 2010), corresponding to 7.3 × 1021 cm−2. The green ellipses are cores. The high-mass cores are plotted with pink ellipses. The white solid circle is the IRAM 30m observation point. The red curve is the skeleton of the filament extracted by getfilaments (Men’shchikov 2013). The black squareis a class II YSO. The black triangle is a class 0/I YSO. The five-pointed star is a class III YSO.
Current usage metrics show cumulative count of Article Views (full-text article views including HTML views, PDF and ePub downloads, according to the available data) and Abstracts Views on Vision4Press platform.
Data correspond to usage on the plateform after 2015. The current usage metrics is available 48-96 hours after online publication and is updated daily on week days.
Initial download of the metrics may take a while.