Fig. 10
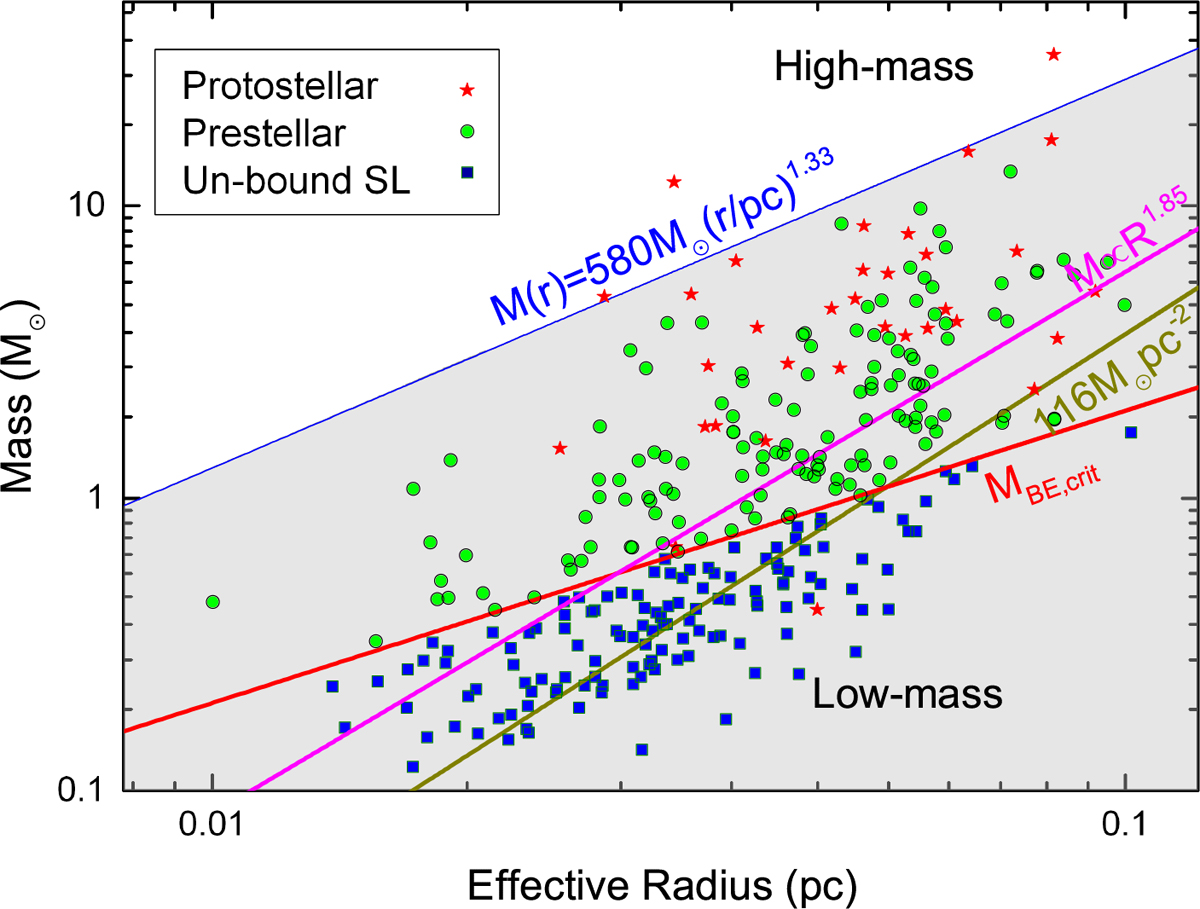
Mass-radius relationship of cores. The red star, green circle, and blue square indicate protostellar, prestellar, and unbound starless cores, respectively. The pink line shows that the mass-radius relationship for all the cores can be well fit with a power law: M ∝ R1.85. The gray shaded region indicates that high-mass stars cannot form (Kauffmann et al. 2010). The green line presents surface densities of 116 M⊙ pc2. The red linepresents the surface density of the critical Bonnor-Ebert sphere.
Current usage metrics show cumulative count of Article Views (full-text article views including HTML views, PDF and ePub downloads, according to the available data) and Abstracts Views on Vision4Press platform.
Data correspond to usage on the plateform after 2015. The current usage metrics is available 48-96 hours after online publication and is updated daily on week days.
Initial download of the metrics may take a while.