Fig. 7.
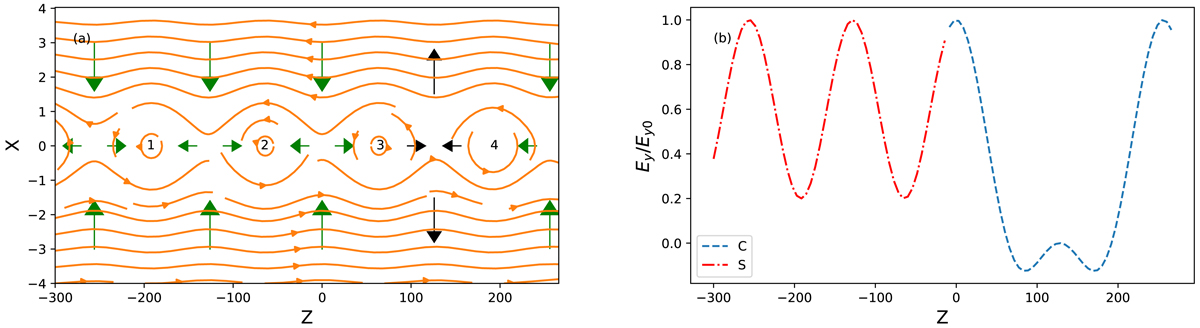
Panel a: plasma inflow (green arrows) and outflow (black arrows) directions in a magnetic islands chain. The solid orange lines show the magnetic field in the x−z plane. Here islands “1” and “2” represent the squashed islands, while islands “3” and “4” represent the coalescent islands. Panel b: red dash-dot line shows the Ey from squashed islands on the midplane from Eq. (17). The blue dash line shows the Ey from coalescent islands on the midplane from Eq. (18). Here k = 0.03125.
Current usage metrics show cumulative count of Article Views (full-text article views including HTML views, PDF and ePub downloads, according to the available data) and Abstracts Views on Vision4Press platform.
Data correspond to usage on the plateform after 2015. The current usage metrics is available 48-96 hours after online publication and is updated daily on week days.
Initial download of the metrics may take a while.