Fig. 6.
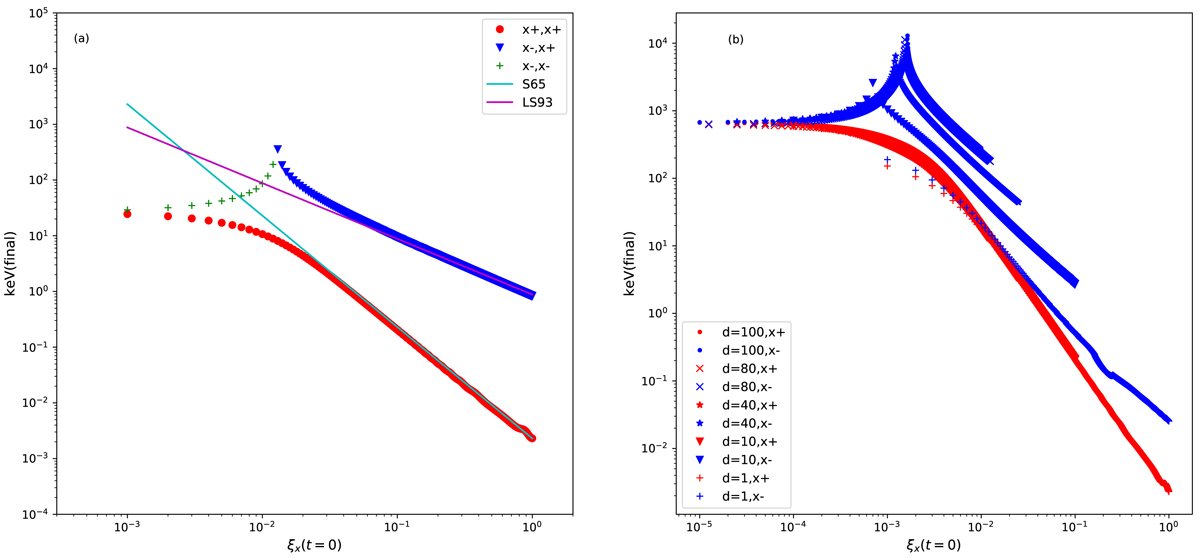
Final energy gains (in keV) of the protons plotted vs. ξx at their initial positions (see Sect. 2.1.1 for more details). Panel a: for RCS with d = 40 m. Panel b: For RCS with different thickness: d = 1 m, 10 m, 40 m, 80 m, 100 m. The “x+, x+”/“x+, x−” and “x−, x+”/“x−, x−” are using the same markers to keep the picture visually clear. Equations (6) and (7) for different d are not plotted in panel b for the same reason. The other parameters are the same as described in Sect. 2.1.1: B0 = 0.01T, E = 100 V m−1, ξy = 0.1.
Current usage metrics show cumulative count of Article Views (full-text article views including HTML views, PDF and ePub downloads, according to the available data) and Abstracts Views on Vision4Press platform.
Data correspond to usage on the plateform after 2015. The current usage metrics is available 48-96 hours after online publication and is updated daily on week days.
Initial download of the metrics may take a while.