Fig. 5.
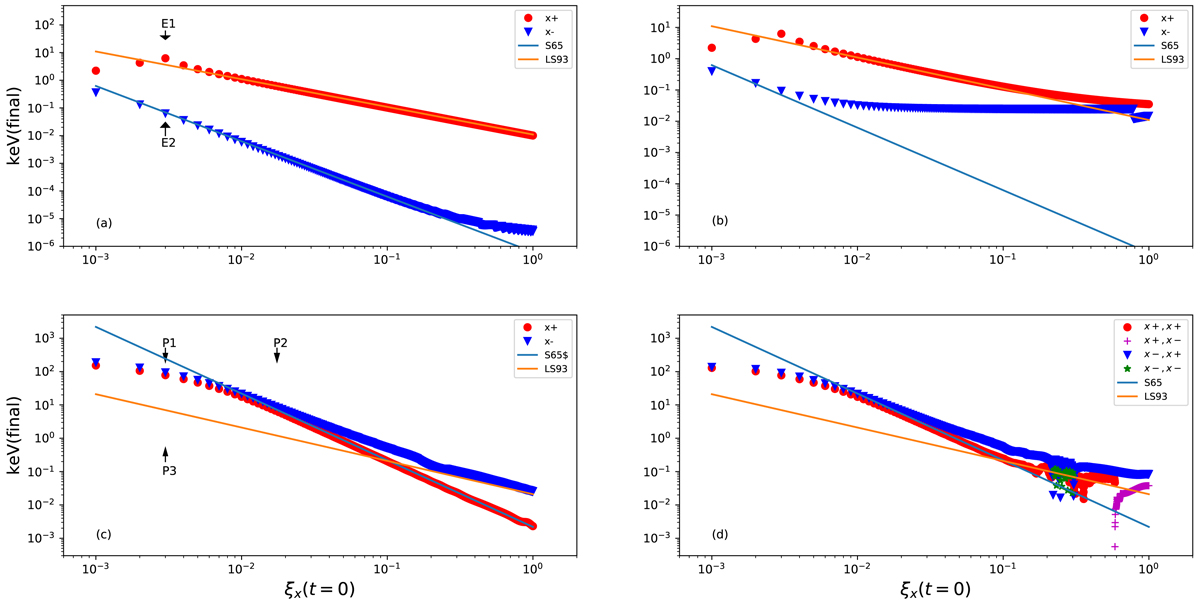
Energy gains (in keV) by electrons and protons at the end of simulation vs. their initial positions ξx (t = 0). The blue triangles represent the particles starting at x = −1 m and the red dots are the ones beginning at x = 1 m. For electrons: panel a: initial velocity vx(t = 0) = 104 m s−1, panel b: vx(t = 0) = 4 × 10⁶ m s−1. For protons: panel c: vx(t = 0) = 104 m s−1, panel d: vx(t = 0) = 105 m s−1. Also, there are protons in the transit group coming back to the lower boundary, and protons in the bounced group that cross the RCS in the ξx > 0.2 region; these are marked by the green stars and purple plus symbols, respectively. The estimated maximum energy gains from Eqs. (6) and (7) are again plotted in solid blue and orange lines. The injecting ξx- coordinates of the selected electrons and protons in Fig. 2 are also marked in panels a and c. The electromagnetic fields are described in Sect. 2.1.1: B0 = 0.01T, E = 100 Vm s−1, ξy = 0.1, d = 1 m.
Current usage metrics show cumulative count of Article Views (full-text article views including HTML views, PDF and ePub downloads, according to the available data) and Abstracts Views on Vision4Press platform.
Data correspond to usage on the plateform after 2015. The current usage metrics is available 48-96 hours after online publication and is updated daily on week days.
Initial download of the metrics may take a while.