Fig. 2.
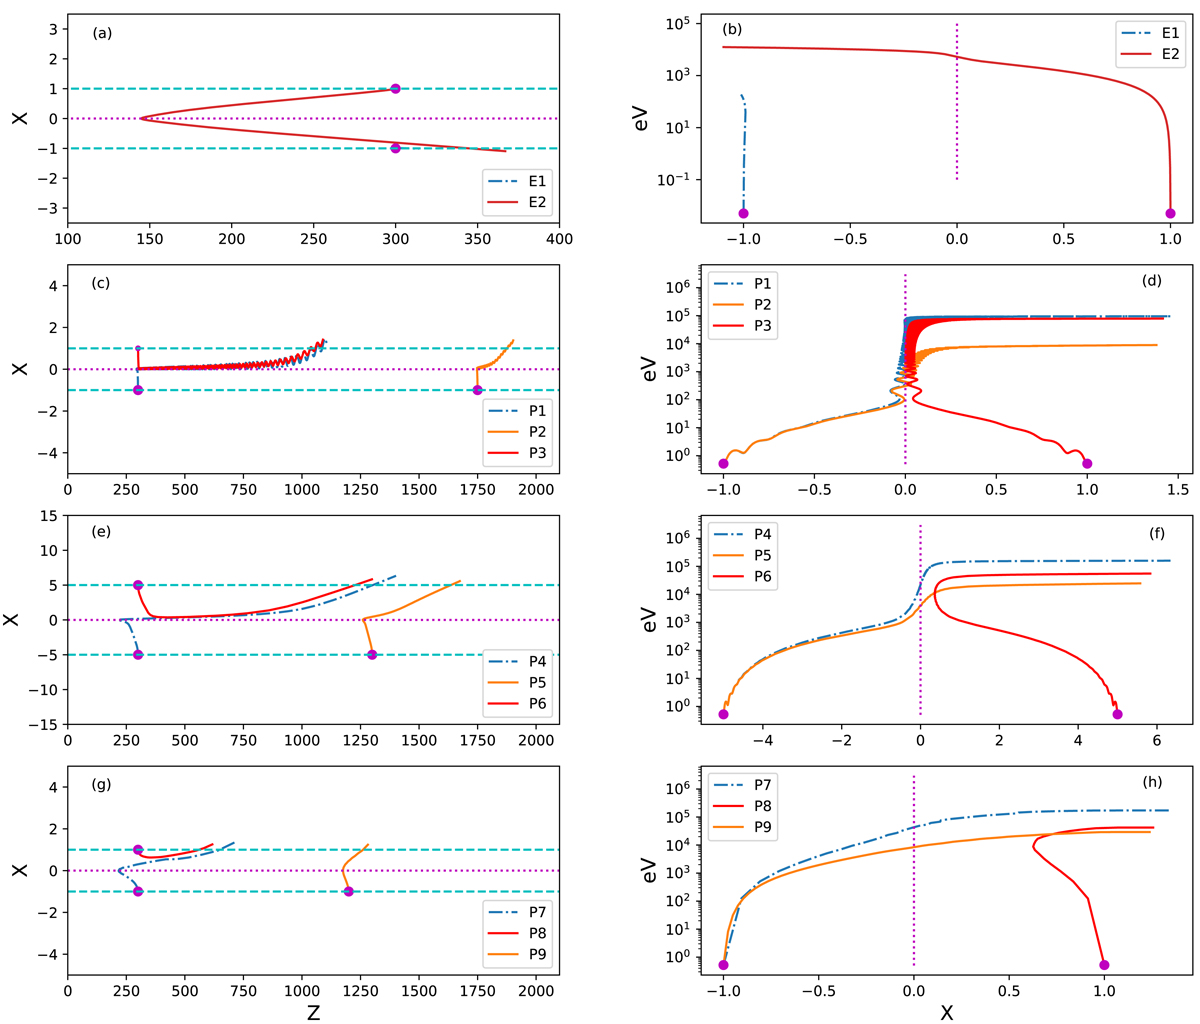
Left panels: simulated particle trajectories on the x−z plane. Right panels: corresponding energy gains vs. the x-coordinate of the particles. Panels a and b: sampled electrons in a simulation with d = 1 m, ξy = 0.1, B0 = 100 G, Ey = 100 V m−1. Light and dark blue lines represent the transit and bounced electrons, respectively. Panels c and d: sampled protons from the same parameters as in panels a and b, respectively. Panels d and f: trajectories of protons from a different simulation with a different d = 5 m. Panels g and h: trajectories of protons in a stronger guiding field, ξy = 1.0 and d = 1 m.
Current usage metrics show cumulative count of Article Views (full-text article views including HTML views, PDF and ePub downloads, according to the available data) and Abstracts Views on Vision4Press platform.
Data correspond to usage on the plateform after 2015. The current usage metrics is available 48-96 hours after online publication and is updated daily on week days.
Initial download of the metrics may take a while.