Fig. 1.
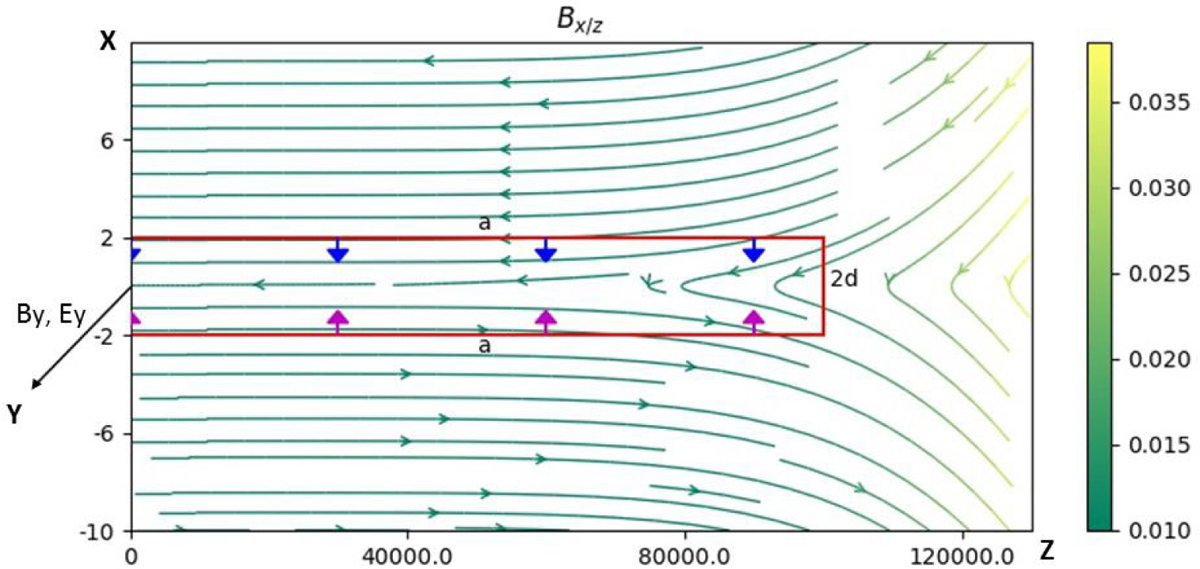
A magnetic field topology in the vicinity of a single X-nullpoint of RCS with a thickness of 2d along the X-axis (+d and −d from X = 0) and a half width of a along the Z-axis. The particle inflows dragged in at the upper boundary (“x+”) are marked by the blue arrows and the ones at the lower boundary (“x−”) by the red arrows. The x = 0 line represents the current sheet midplane. The green lines show magnetic field lines of Bx and Bz, with the guiding field By and reconnecting electric field Ey being perpendicular to the plane of drawing.
Current usage metrics show cumulative count of Article Views (full-text article views including HTML views, PDF and ePub downloads, according to the available data) and Abstracts Views on Vision4Press platform.
Data correspond to usage on the plateform after 2015. The current usage metrics is available 48-96 hours after online publication and is updated daily on week days.
Initial download of the metrics may take a while.