Fig. 9
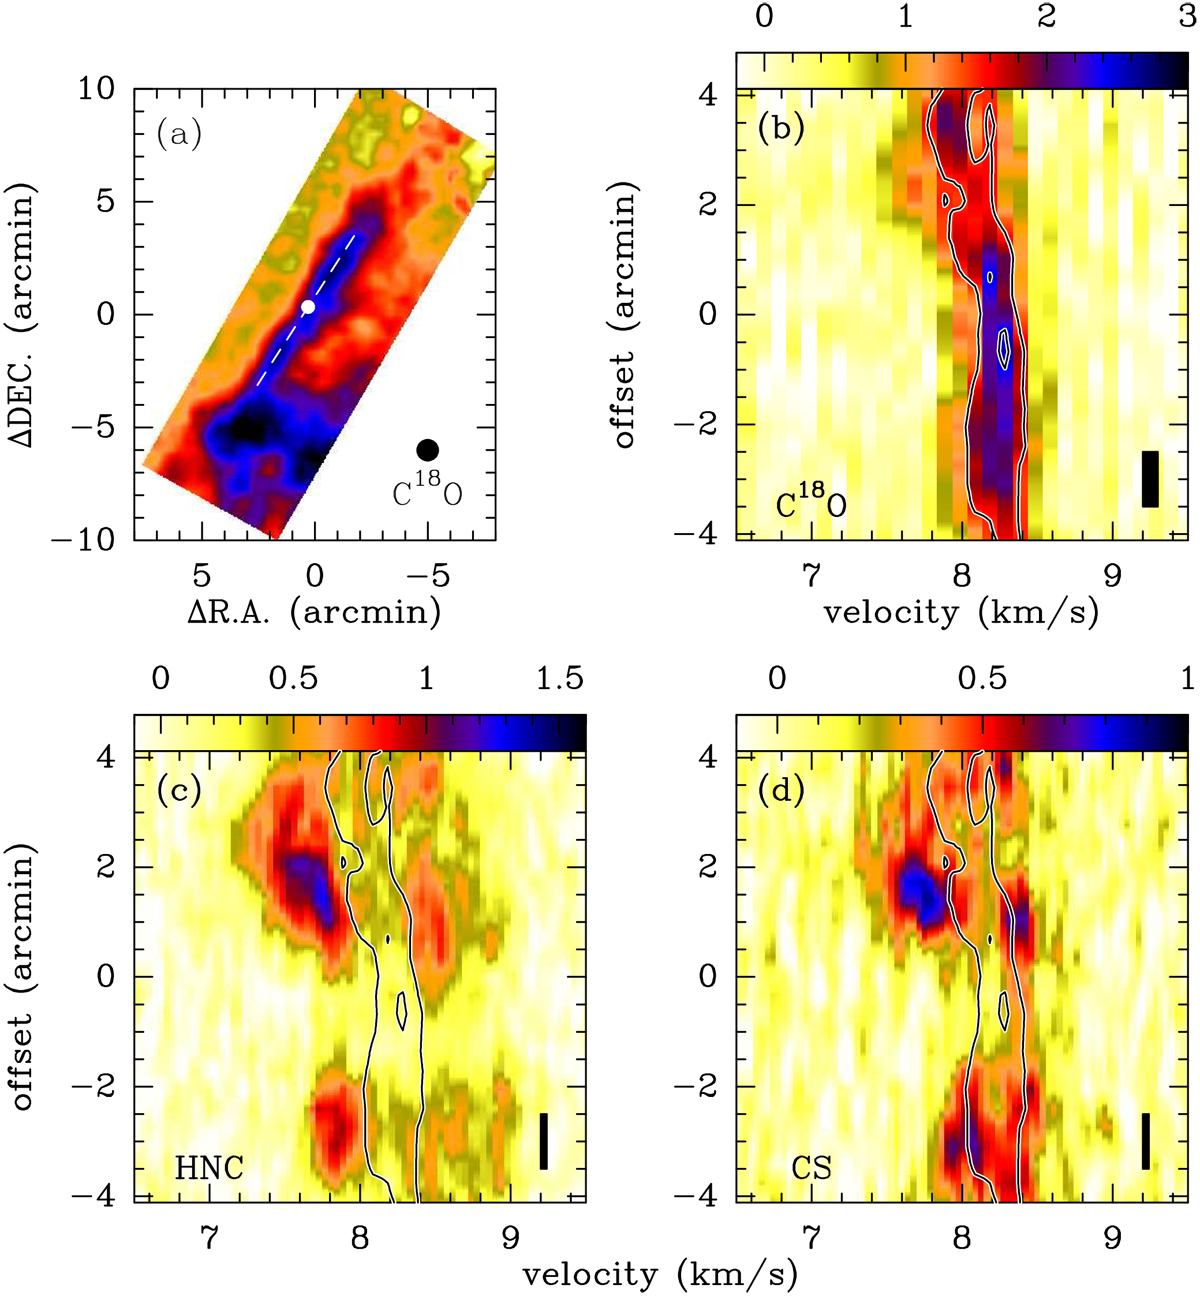
Panel a: C18O (1–0) integrated intensity map similar to Fig. 2b but overlaid with a PV cut indicated by the white dashed line. Panel b: PV diagram of C18 O (1–0) along the PV cut in panel a. The channel width of C18O (1–0) spectra has been binned to 0.1 km s−1 to achieve a higher dynamical range. Panel c: similar to panel b but for HNC (1–0). Panel d: similar to panel b but for CS (2–1). In panels b–d, the color bars represent main beam brightness temperatures in units of K, and the black contours represent the C18 O (1–0) emission starting at 1.5 K (5σ) with increments of 0.9 K (3σ). The offsets are given with respect to the center of the PV cut (αJ2000 = 18h28m50.s865, δJ2000 = 00°50′21. ′′799, also indicated by the white filled circle in panel a), and increase from southeast to northwest. The resolution element is shown in the lower right of each panel.
Current usage metrics show cumulative count of Article Views (full-text article views including HTML views, PDF and ePub downloads, according to the available data) and Abstracts Views on Vision4Press platform.
Data correspond to usage on the plateform after 2015. The current usage metrics is available 48-96 hours after online publication and is updated daily on week days.
Initial download of the metrics may take a while.