Fig. 7
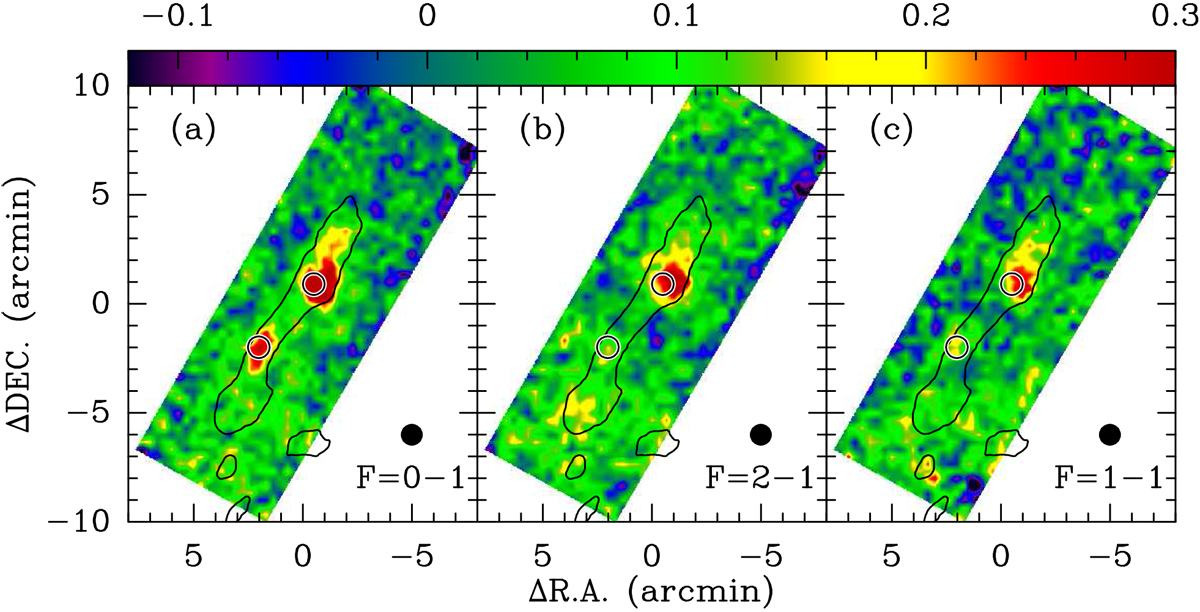
HCN (1–0) intensity maps of the Serpens filament integrated from 0.0 to 1.6 km s−1 (panel a), integrated from 7.0 to 8.6 km s−1 (panel b), and integrated from 11.7 to 13.6 km s−1 (panel c) with respect to the frequency of the F = 2–1 hyperfine structure component. The three ranges correspond to the F = 0−1, F = 2− 1, and F = 1−1 hyperfine structure components, respectively. The color bar represents the integrated intensities in units of K km s−1. In all panels, the overlaid black contours denote H2 column densities of 6 × 1021 cm−2, while the two open circles give the observed positions of sources A and B. In all panels, the (0, 0) offset corresponds to αJ2000 = 18h28m49.s642, δJ2000 = 00°50′01.′′08. The beam size is shown in the lower right of each panel.
Current usage metrics show cumulative count of Article Views (full-text article views including HTML views, PDF and ePub downloads, according to the available data) and Abstracts Views on Vision4Press platform.
Data correspond to usage on the plateform after 2015. The current usage metrics is available 48-96 hours after online publication and is updated daily on week days.
Initial download of the metrics may take a while.