Fig. 4
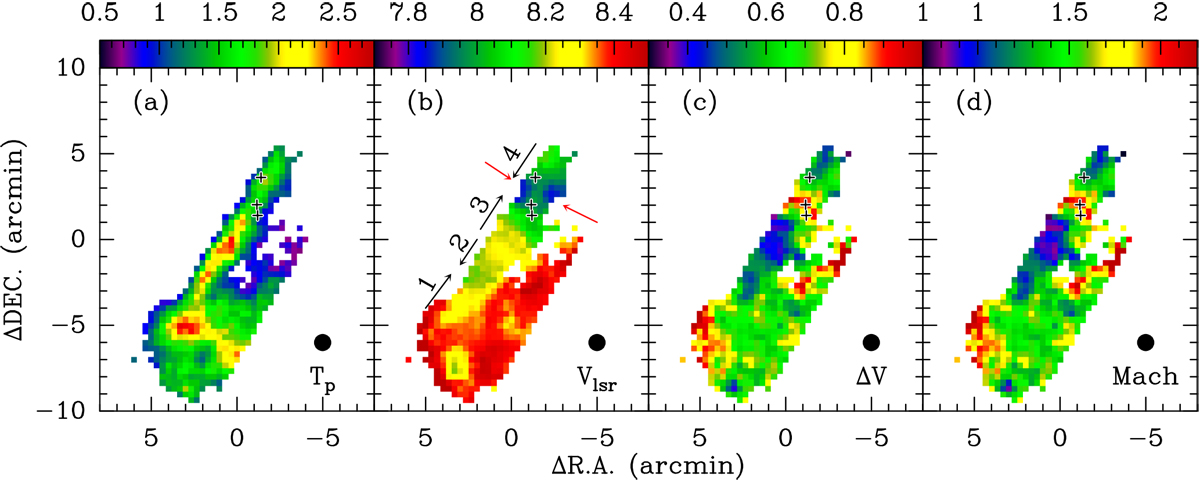
Maps of peak intensities (panel a), LSR velocities (panel b), linewidths (panel c), and Mach numbers (panel d) derived from single-component Gaussian fits to our C18 O (1–0) data. The color bars represent main beam brightness temperatures in units of K in panel a, LSR velocities in units of km s−1 in panel b, and linewidths in units of km s−1 in panel c. Velocity gradients along the filament and perpendicular to the filament are indicated by the blackand red arrows in panel b, respectively. In all panels, the (0, 0) offset corresponds to αJ2000 = 18h28m49.s642, δJ2000 = 00°50′01.′′08, and the three black crosses give the positions of the three embedded YSOs (see Fig. 1). The mean uncertainties in derived peak intensities, LSR velocities, linewidths, and Mach numbers are 0.19 K, 0.02 km s−1, 0.06 km s−1, and 0.1, respectively. The beam size is shown in the lower right of each panel.
Current usage metrics show cumulative count of Article Views (full-text article views including HTML views, PDF and ePub downloads, according to the available data) and Abstracts Views on Vision4Press platform.
Data correspond to usage on the plateform after 2015. The current usage metrics is available 48-96 hours after online publication and is updated daily on week days.
Initial download of the metrics may take a while.