Fig. 3
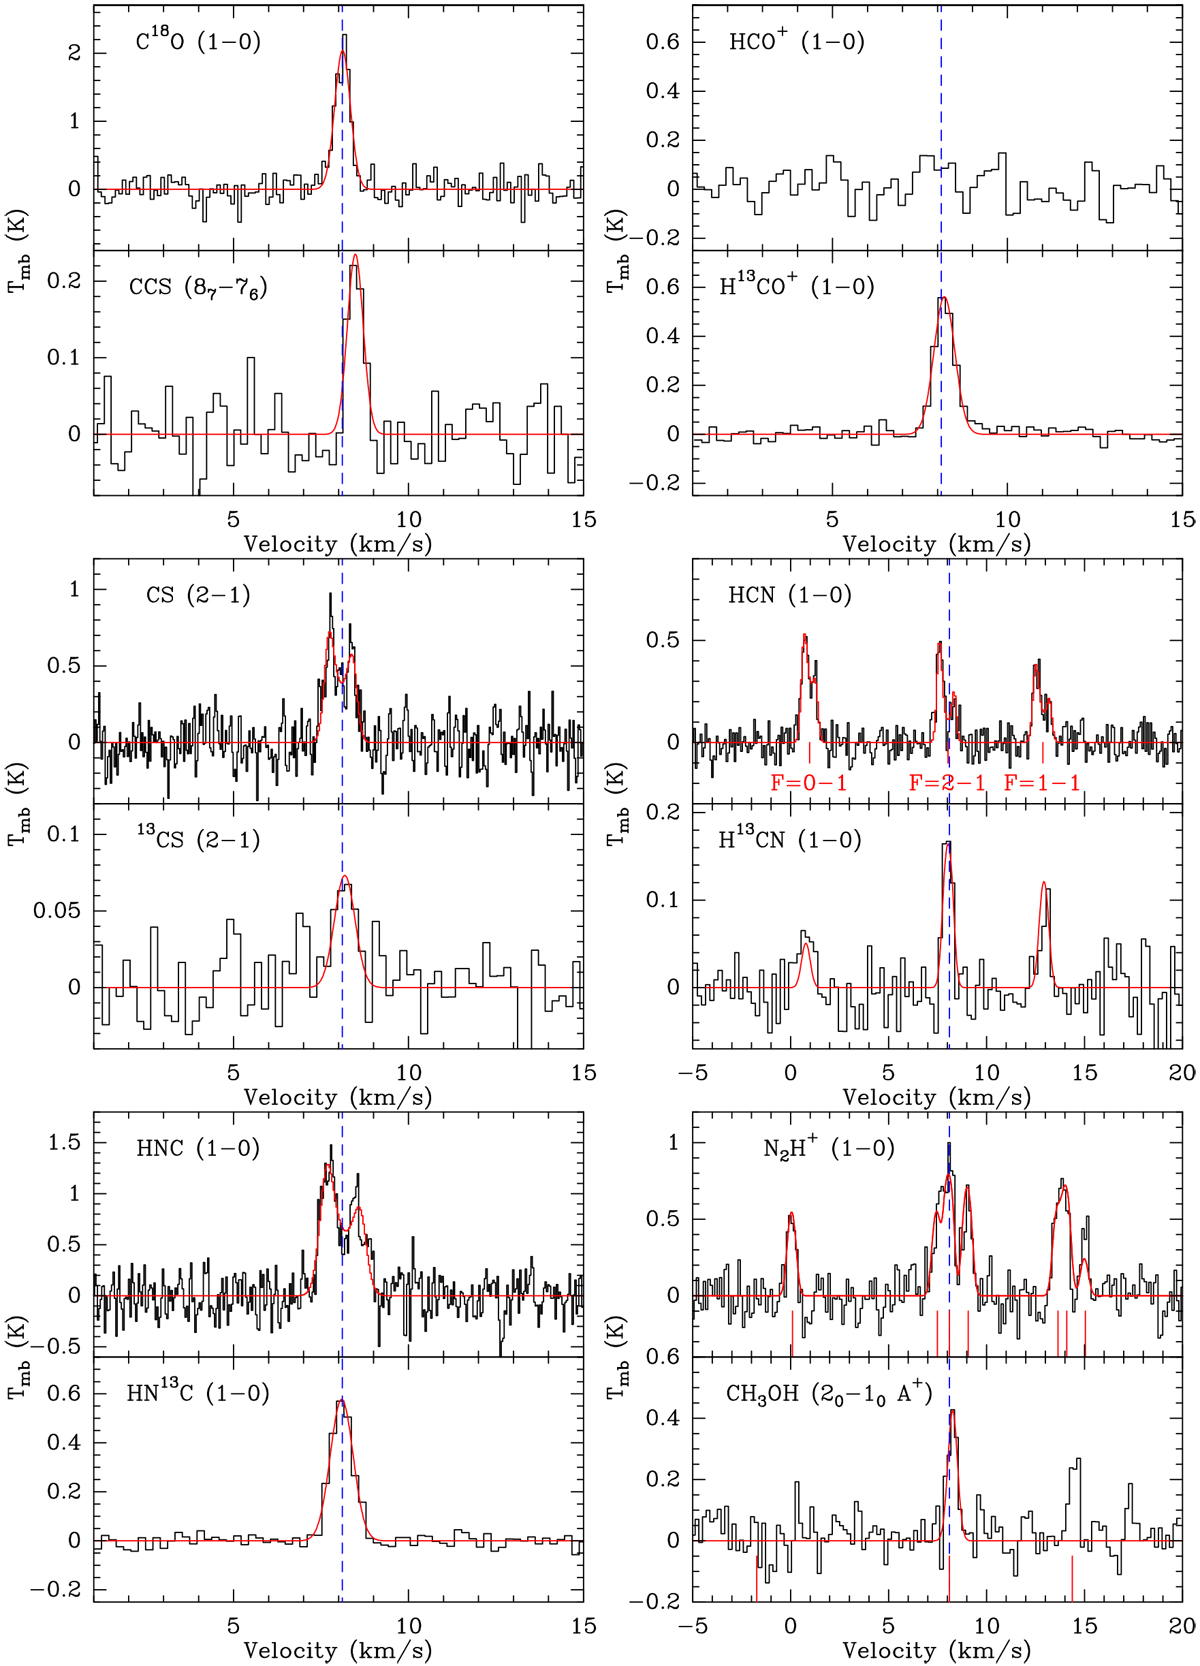
Single-pixel spectra (black lines) of all detected molecules toward Source A. Species are given in the upper left of each panel. In all panels, the vertical blue dashed lines represent the systemic velocity obtained from C18 O (1–0). Single-peaked spectra are modeled with a Gaussian fit. The blue-skewed line profiles of CS (2–1), HCN (1–0), and HNC (1–0) are fitted with the Hill5 model (De Vries & Myers 2005). For H13 CN (1–0) and N2H+ (1–0), the spectra are fitted with the hyperfine structure fitting subroutine in GILDAS. All fitted results are shown in red lines. The velocities of the N2 H+ (1–0) hyperfine structure components are indicated by vertical red lines. In the CH3 OH panel where the velocity is given with respect to the rest frequency (96.74138 GHz) of CH3 OH (20 − 10 A+), the CH3OH triplet around 96.74 GHz is also indicated by three vertical red lines.
Current usage metrics show cumulative count of Article Views (full-text article views including HTML views, PDF and ePub downloads, according to the available data) and Abstracts Views on Vision4Press platform.
Data correspond to usage on the plateform after 2015. The current usage metrics is available 48-96 hours after online publication and is updated daily on week days.
Initial download of the metrics may take a while.