Fig. 2
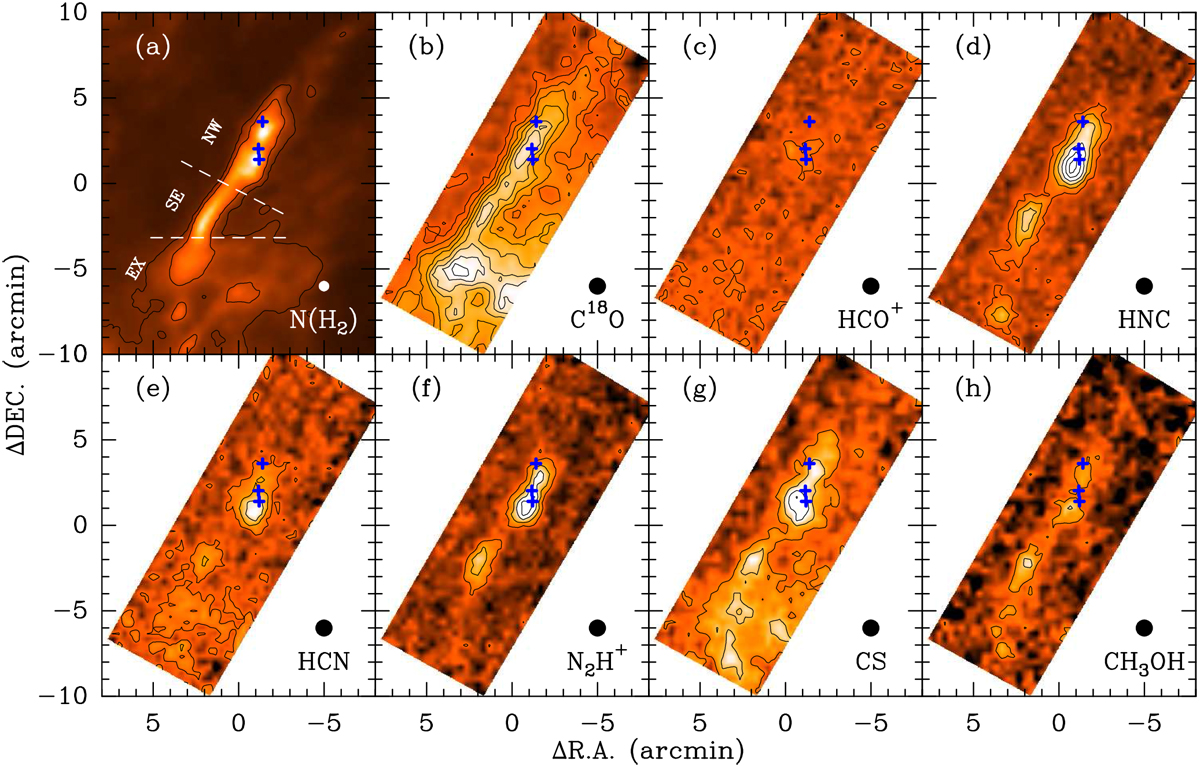
Spatial distributions of different molecular species, labeled in the lower right of each panel, over the Serpens filament. Panel a: Herschel H2 column density image. The contours are H2 column densities of 4 × 1021 cm−2 and 6 × 1021 cm−2. This region is divided by the two white dashed lines into three individual regions which are labeled NW (northwest), SE (southeast), and EX (extended). Panel b: C18 O (1–0) intensity map integrated from 7.4 to 8.7 km s−1. The contours start at 0.30 K km s−1 (5σ), and increase by 0.18 K km s−1 (3σ). Panel c: HCO+ (1–0) intensity map integrated from 6.5 to 9.5 km s−1. The contours start at 0.27 K km s−1, and increase by 0.27 K km s−1. Panel d: HNC (1–0) intensity map integrated from 7.0 to 9.0 km s−1. The contours start at 0.24 K km s−1, and increase by 0.24 K km s−1. Panel e: HCN (1–0) intensity map integrated from 0 to 1.6 km s−1, from 7.0 to 8.6 km s−1, and from 11.8 to 13.4 km s−1 relative to the frequency of the F = 2–1 hyperfine structure component. The contours start at 0.27 K km s−1, and increase by 0.27 K km s−1. Panel f: N2H+ (1–0) intensity map integrated from 6.5 to 9.5 km s−1. The contours start at 0.30 K km s−1, and increase by 0.30 K km s−1. Panel g: CS (2–1) intensity map integrated from 7.0 to 9.5 km s−1. The contours start at 0.18 K km s−1, and increase by 0.18 K km s−1. Panel h: CH3OH (20 –10) intensity map integrated from 7.5 to 8.8 km s−1. The contours start at 0.12 K km s−1, and increase by 0.12 K km s−1. In all panels, the (0, 0) offset corresponds to αJ2000 = 18h28m49.s642, δJ2000 = 00°50′01.′′08, and the three blue crosses give the positions of the three embedded YSOs (see also Fig. 1). The beam size is shown in the lower right of each panel.
Current usage metrics show cumulative count of Article Views (full-text article views including HTML views, PDF and ePub downloads, according to the available data) and Abstracts Views on Vision4Press platform.
Data correspond to usage on the plateform after 2015. The current usage metrics is available 48-96 hours after online publication and is updated daily on week days.
Initial download of the metrics may take a while.