Fig. B.1
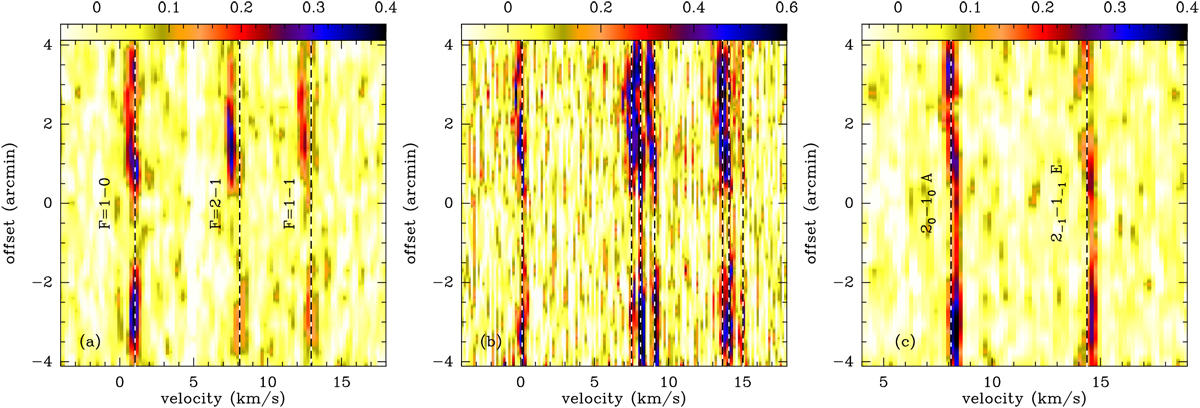
PV diagrams similar to Fig. 9b but for HCN (1–0) (panel a), N2 H+ (1–0) (panel b), and two CH3OH lines (panel c). In panel a, the three hyperfine structure components are labeled next to their respective emission. In panel b, the channel width of the N2H+ (1–0) spectra has been binned to 0.16 km s−1 to achieve a higher dynamical range in individual channels. In panel c, the two transitions are labeled next to their respective emission. In all panels, the color bars represent main beam brightness temperatures in units of K. The offsets are given with respect to the center of the PV cut (αJ2000 = 18h28m50.s865, δJ2000 = 00°50′21. ′′799, also indicated by the white filled circle in Fig. 9a), and increase from southeast to northwest. In all panels, the vertical dashed lines mark the systemic velocity of −8.11 km s−1 for corresponding lines.
Current usage metrics show cumulative count of Article Views (full-text article views including HTML views, PDF and ePub downloads, according to the available data) and Abstracts Views on Vision4Press platform.
Data correspond to usage on the plateform after 2015. The current usage metrics is available 48-96 hours after online publication and is updated daily on week days.
Initial download of the metrics may take a while.