Fig. 12
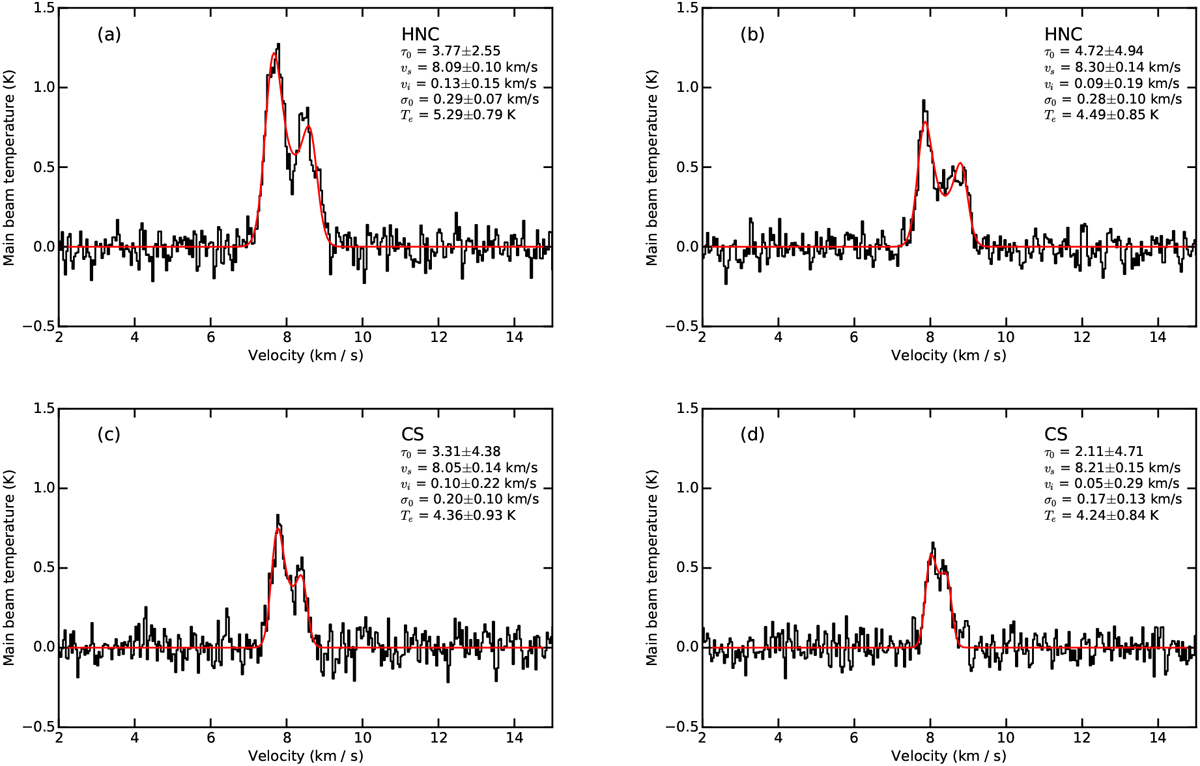
Panel a: HNC (1–0) spectrum averaged over 3 × 3 pixels centered at an offset of (−40′′, 40′′) in Fig. 2 to increase the signal-to-noise level. Panel b: similar to panel a, but for an offset of (100′′, −120′′). Panel c: similar to panel a, but for CS (2–1). Panel d: similar to panel b, but for CS (2–1). All these lines are modeled with the Hill5 model (De Vries & Myers 2005; see Sect. 4.3). These offsets are given with respect to αJ2000 = 18h28m49.s642, δJ2000 = 00°50′01.′′08. The fitted parameters and their uncertainties are given in the upper right of each panel.
Current usage metrics show cumulative count of Article Views (full-text article views including HTML views, PDF and ePub downloads, according to the available data) and Abstracts Views on Vision4Press platform.
Data correspond to usage on the plateform after 2015. The current usage metrics is available 48-96 hours after online publication and is updated daily on week days.
Initial download of the metrics may take a while.