Fig. 11
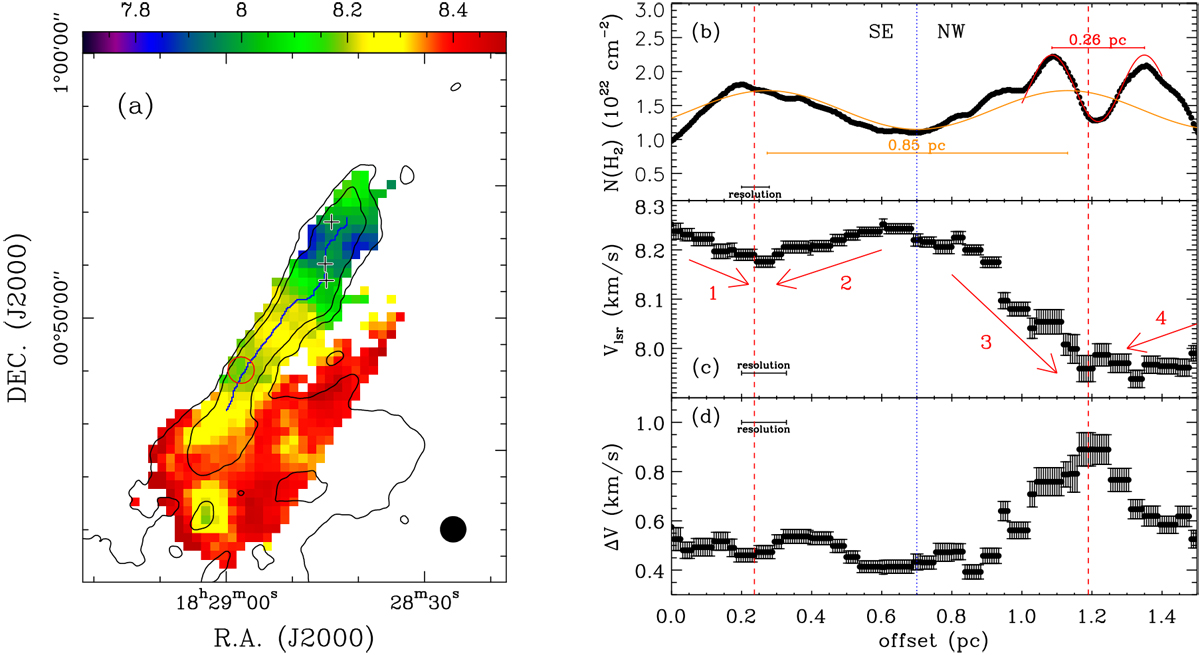
Panel a: LSR velocity map similar to Fig. 4b but overlaid with the H2 column density contours which represent 4 × 1021 cm−2 and 6 × 1021 cm−2. Source B is marked with the red circle, and the three black crosses give the positions of the three embedded YSOs, em10, em28, and em16. Panel b: column density profile along the crest of the Serpens filament indicated by the blue line in panel a. The spatial resolution is ~0.08 pc. The offset increases from south to north. The red line represents a sinusoidal fit to the profile within the offset range of 1.0–1.4 pc. A sinusoidal orange line is created to better visualize the variation at a large scale. Panel c: similar to panel b, but for the C18 O (1–0) velocity. The four red arrows correspond to the velocity gradients in Fig. 4b, indicated there by black arrows. Panel d: similar to panel c, but for the C18 O (1–0) linewidths. In panels b–d, the red dashed lines indicate the positions of Source B and the YSO emb28.
Current usage metrics show cumulative count of Article Views (full-text article views including HTML views, PDF and ePub downloads, according to the available data) and Abstracts Views on Vision4Press platform.
Data correspond to usage on the plateform after 2015. The current usage metrics is available 48-96 hours after online publication and is updated daily on week days.
Initial download of the metrics may take a while.