Fig. 10
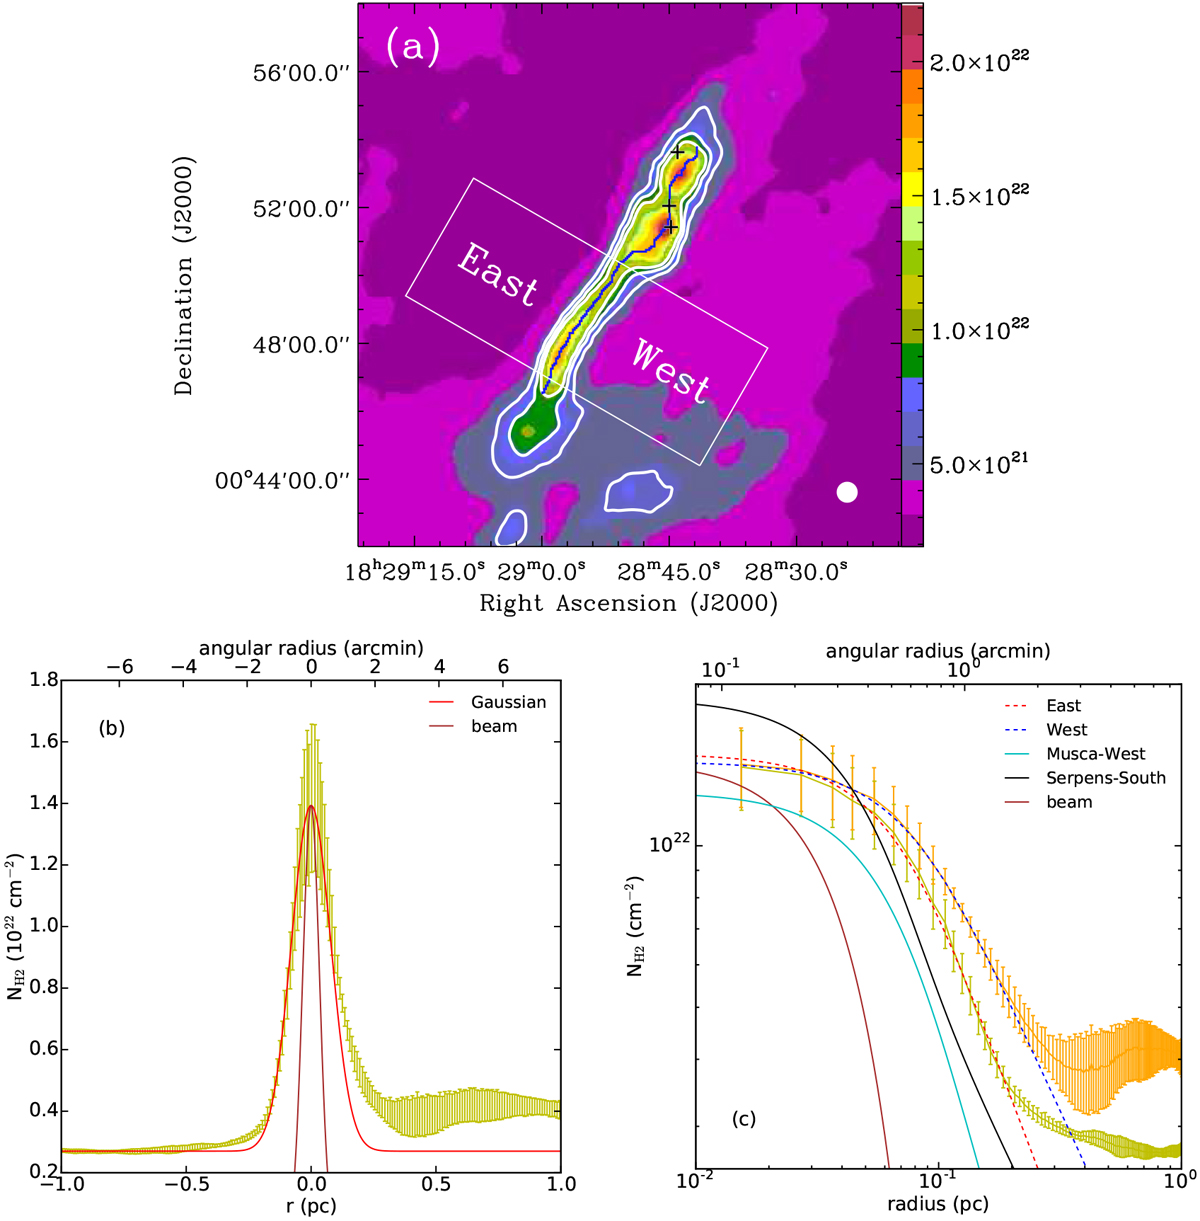
Panel a: H2 column density image of the Serpens filament obtained from the Herschel Gould belt survey. The contours correspond to column densities of 6 × 1021 cm−2, 8 × 1021 cm−2, and 1 × 1022 cm−2. The extracted crest of the Serpens filament is shown with the blue line. The emission within the white box is used to derive the radial profile of H2 column density. The three black crosses give the positions of the three embedded YSOs. The beam size is shown in the lower right. Panel b: mean radial profile of H2 column densities within the white box in panel a. The offsets increase from east to west. A Gaussian fit is indicated by the red line. Panel c: mean radial H2 column density profile on the west (yellow) and east (orange) sides of the crest. The red and blue dashed lines represent Plummer-like fits to the east and west (see panel a) within a radius range of <0.2 pc, while the cyan and black lines represent the beam-convolved radial profile of Musca-West (Kainulainen et al. 2016) and the Serpens South filament (Kirk et al. 2013). In both panels a and b, the beam size is shown by the brown line.
Current usage metrics show cumulative count of Article Views (full-text article views including HTML views, PDF and ePub downloads, according to the available data) and Abstracts Views on Vision4Press platform.
Data correspond to usage on the plateform after 2015. The current usage metrics is available 48-96 hours after online publication and is updated daily on week days.
Initial download of the metrics may take a while.