Fig. 1
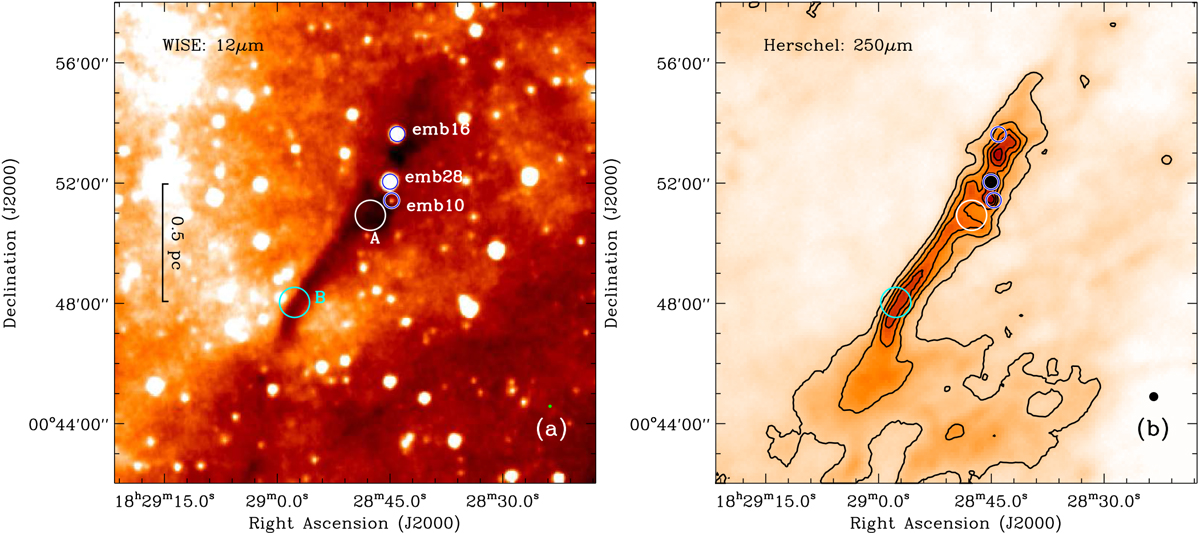
Panel a: WISE 11.2 μm image of the Serpens filament that shows up in absorption. Panel b: Herschel 250 μm image of the Serpens filament. The contours start at 0.5 Jy beam−1, and increase by 0.5 Jy beam−1. In both panels, the three blue circles mark the embedded YSOs emb10, emb16, and emb28 (Enoch et al. 2009), while the white and cyan circles give the selected positions of Source A and Source B (see Sect. 2.1 and Table 1). The beam size is shown in the lower right of each panel.
Current usage metrics show cumulative count of Article Views (full-text article views including HTML views, PDF and ePub downloads, according to the available data) and Abstracts Views on Vision4Press platform.
Data correspond to usage on the plateform after 2015. The current usage metrics is available 48-96 hours after online publication and is updated daily on week days.
Initial download of the metrics may take a while.