Fig. 2.
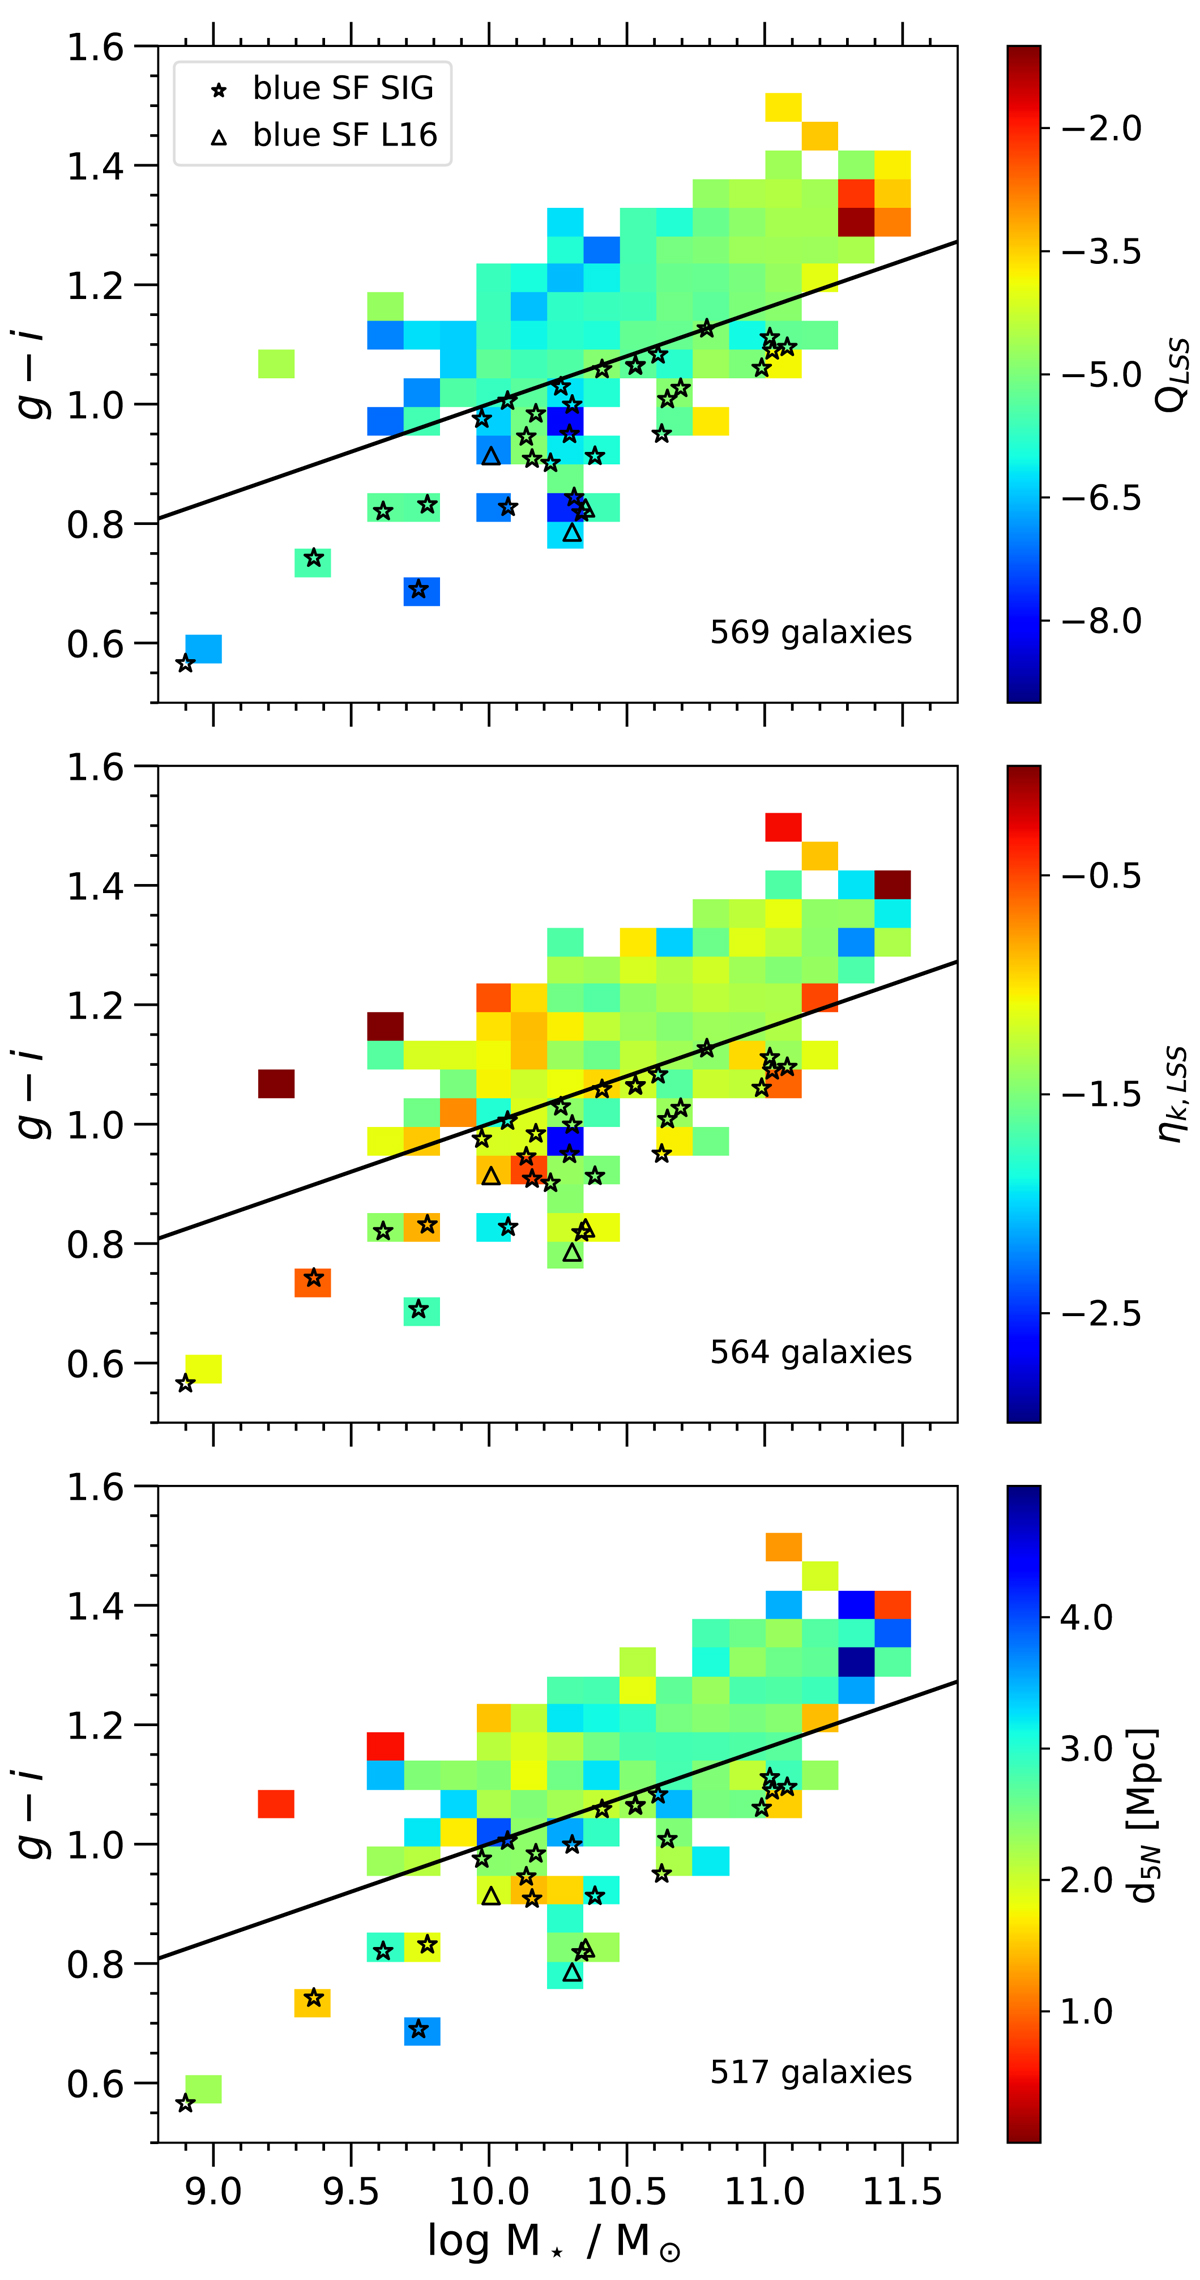
As a function of stellar mass, measured g − i color for isolated E galaxies. The black line shows Eq. (15) to separate red and blue galaxies. The open black stars and open black triangles show the blue SF isolated ellipticals from the SIG and L16 samples, respectively. The color bars correspond to the QLSS parameter (top panel), ηk,LSS parameter (middle panel), and the distance to the fifth nearest neighbor galaxy out to 5 Mpc (bottom panel). The total number of galaxies is indicated in each panel.
Current usage metrics show cumulative count of Article Views (full-text article views including HTML views, PDF and ePub downloads, according to the available data) and Abstracts Views on Vision4Press platform.
Data correspond to usage on the plateform after 2015. The current usage metrics is available 48-96 hours after online publication and is updated daily on week days.
Initial download of the metrics may take a while.